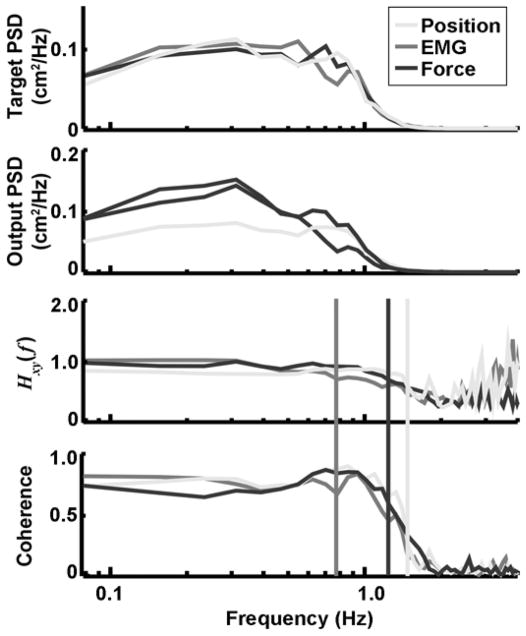
Figure 4.
Frequency domain analyses of tracking performance. Data are from same subject shown in Figure 3, except that all three trials are used in these calculations. Power spectra were calculated with frequency resolution of 0.08 Hz. From top: Power spectral densities (PSD) of targets (x) and outputs (y), followed by transfer (Hxy) and coherence functions, all as function of frequency (f). Bandwidths of 1.50, 0.80, and 1.25 are marked by corresponding vertical lines for position, electromyography (EMG), and force, respectively.

