
Fig. 4.
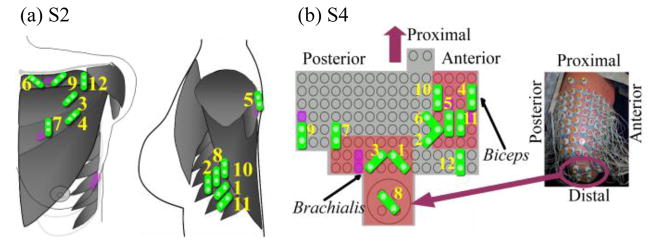
Schematic description of the Suboptimal Configurations for classifying 16 movements. The representative data are from (a) S2 and (b) S4. As points of reference, the purple electrodes demonstrate the locations of direct control sites. Green electrodes indicate the suboptimal electrodes. Each electrode is labeled with a number that indicates its sequence of selection using SFS.