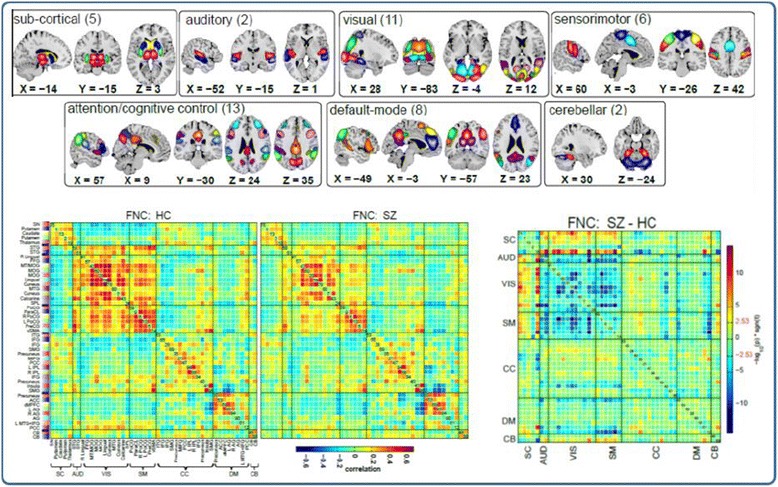
Figure 6.

Example of parcellation using ICA [ 60 ] including component maps (top) separated into categories based on the anatomic location and FNC or among-network connectivity which can be summarized via the cross-correlation among network time courses (bottom). Results for health individuals (HC), patients with schizophrenia (SZ), and the difference are also shown.
