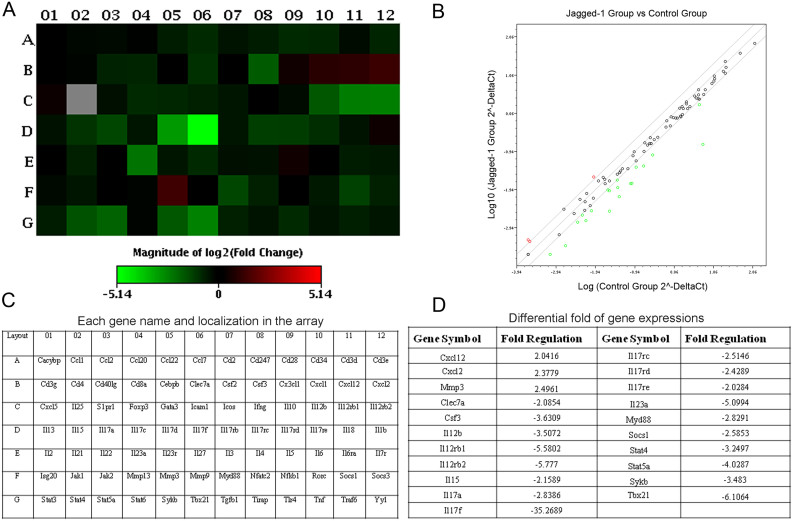
Figure 2. Differential expressions of the genes relevant to the Th17 cell differentiation by Jagged-1 signaling.
(A) The heat map provides a graphical representation of expression fold between the Jagged-1-treated CD4+ T cells (Jagged-1 group) and the untreated CD4+ T cells (control group). Red indicates the upregulated genes and green, the downregulated genes. (B) The both groups are overlaid onto the qPCR Array plate layout with genes' name and their location. (C) The relative expressional levels for each gene in the Jagged-1 group and the control group are plotted against each other in the scatter plot. Red shows the upregulated genes and green, the downregulated genes. (D) Up/downregulated genes in CD4+ T cells from the Jagged-1 group are compared with the control group. Fold-change values greater than two hint the positive regulation, and fold-change values less than two, the negative regulation. Two independent experiments were repeated.

