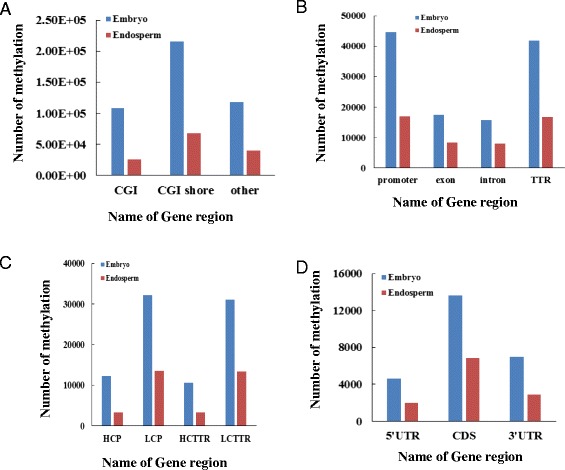
Figure 3.

Distribution of DNA methylated peaks in gene regions. Distribution of DNA methylation peaks in CGIs, CGI shores and other regions (A), Distribution of DNA methylation peaks in TTRs, promoters, exons and introns (B), Distribution of DNA methylation peaks in HCP, LCP, HCTTR and LCTTR (C). Distribution of DNA methylation peaks in CDs, 5’UTR and 3’UTR (D).
