
Figure 4.
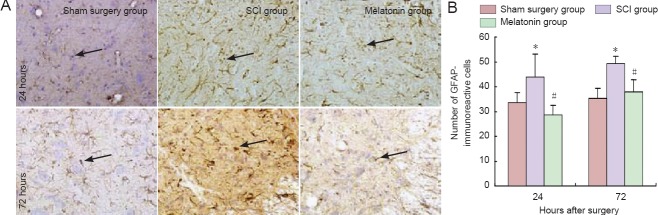
Changes in the expression of GFAP-immunoreactive cells at 24 and 72 hours after injury. (A) Immunohistochemical staining (optical microscope, × 200). Arrows: GFAP-immunoreactive cells. (B) Changes in the number of GFAP-immunoreactive cells. *P < 0.05, vs. sham surgery group; #P < 0.05, vs. SCI group. Data are expressed as the mean ± SD (n = 5; one-way analysis of variance and the least significant difference test). SCI: Spinal cord injury; GFAP: glial fibrillary acidic protein.