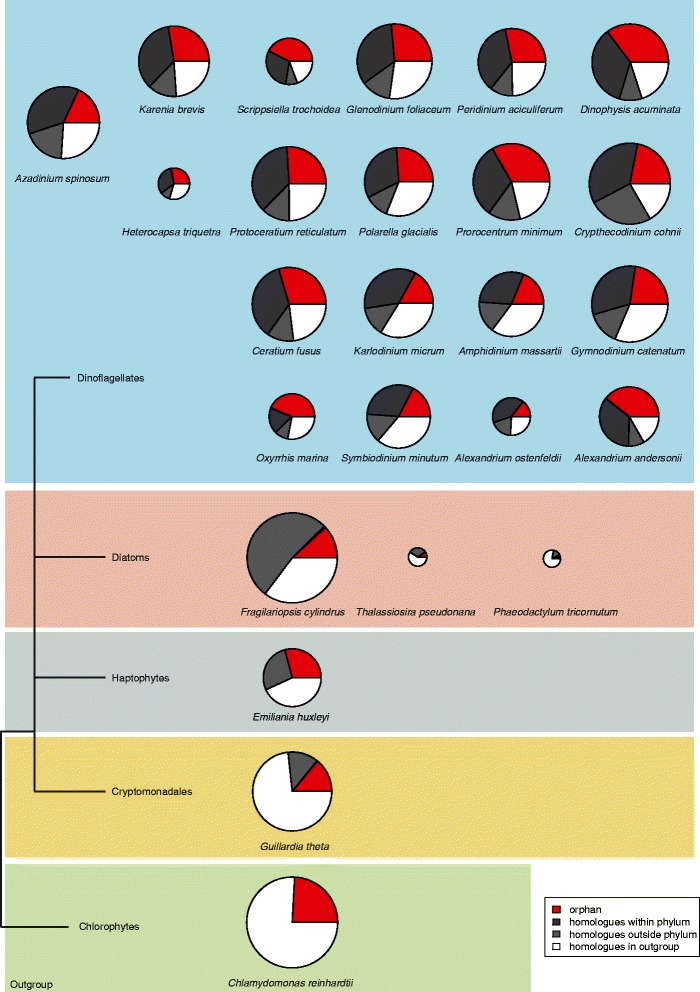
Figure 2.

Transcriptomic data reveals proteins conserved between different dinoflagellates and outgroup species. Comparison between 19 dinoflagellate species including A. spinosum, three diatoms, the haptophyte Emiliania huxleyi, and the cryptomonad Guillardia theta. The size of the pie charts is proportional to the number of sequences analysed. The colour code indicates the hierarchical classification into homology groups defined by descending evolutionary distance, e.g., if a sequence had BLAST hits in the outgroup species Chlamydomonas reinhardtii, it was classified as “homologues in outgroup” irrespective of potential homologues inside the phylum. The schematic phylogeny to the left of the figure represents the relationship between the species analysed. Details about origin and number of sequences analysed can be found in Additional file 3: Table S1.
