
Figure 5.
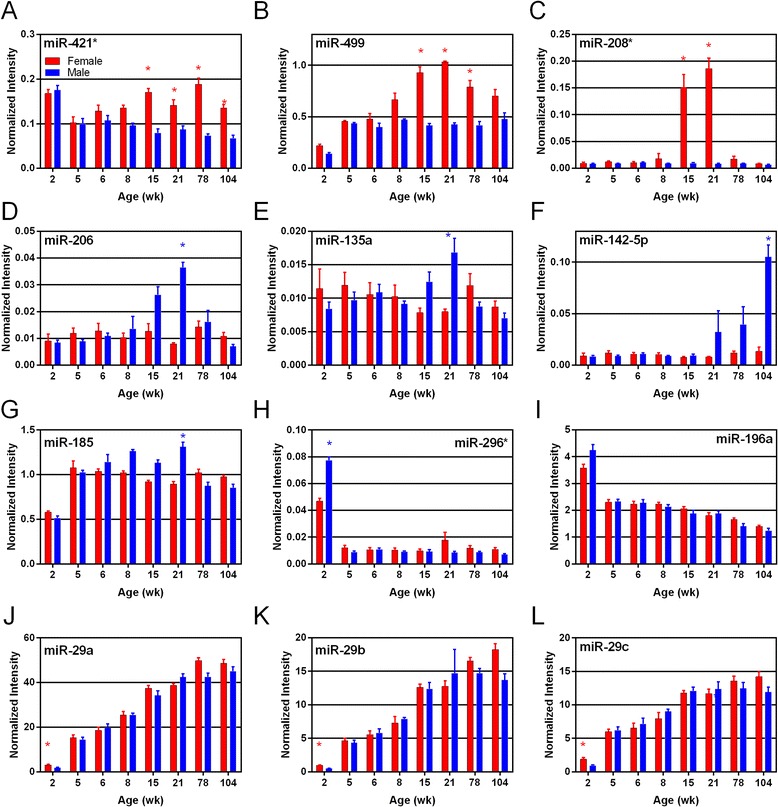
Plots of individual miRNAs (microarray data) exhibiting sex and age differences in expression are shown ( n = 4 or 5). A, B, and C show miRNAs exhibiting female-biased miRNA expression; D, E, F, and G show male-biased miRNAs; H and I show young age expressed miRNAs; and J, K, and L show old age expressed miRNAs. Bars represent normalized intensity values per age group; blue and red colors represent male and female data, respectively. Asterisks indicate ages where sex difference in expression is statistically significant (t-test, FDR <5%).