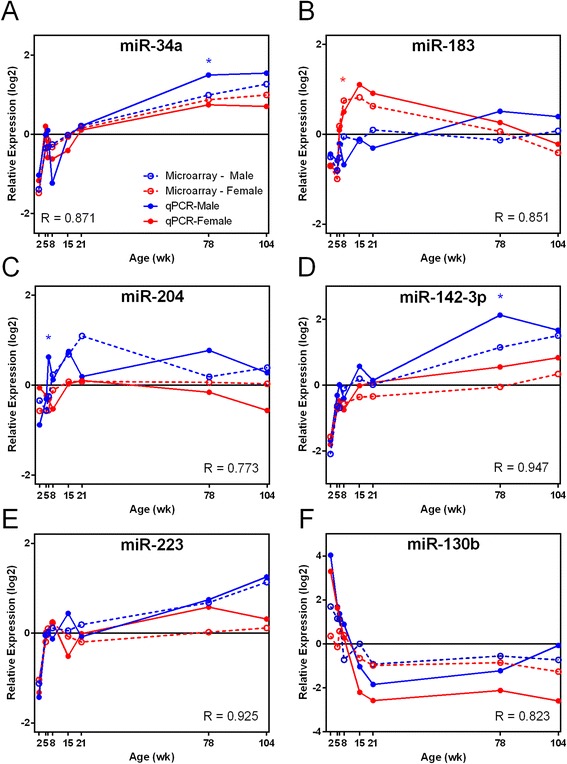
Figure 7.

Select miRNAs exhibiting sex and age differences were verified by Taqman qPCR. A, E, and F show age related changes in miRNA expression; B, C, and D show sex related changes in expression. MiRNA expression relative to the mean expression level (relative expression log2) is shown on Y axis. Microarray and qPCR data are represented by dotted and solid lines, respectively. Male and female are indicated by blue and red colors, respectively. The Pearson correlation coefficient (R) was calculated between microarray and qPCR data for each miRNA. Asterisks indicate ages where statistical difference in expression between sexes exists according to pairwise t-test (p < 0.05) for each age in qPCR data.
