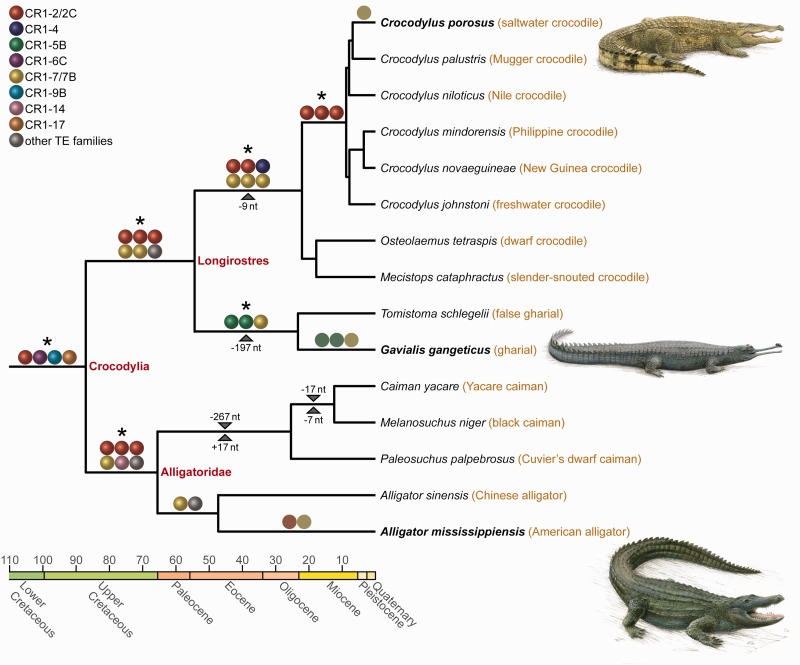
Fig. 1.—
CR1 retroposons resolve the early branches in the crocodilian tree of life. Retroposon markers (colored balls) and non-TE indel markers (triangles with number of inserted/deleted nucleotides) are mapped on Oaks’s (Oaks 2011) dated tree of crocodilians (colors on the time axis correspond to the respective geological epoch in the International Stratigraphic Chart; http://www.stratigraphy.org/ICSchart/StratChart2010.pdf last accessed January 13, 2015). Presence/absence states (supplementary table S1, Supplementary Material online) are based on per-locus alignments (supplementary data S1, Supplementary Material online) and species-specific autapomorphic retroposon insertions are depicted as colored circles. Statistically significant retroposon support sensu Waddell et al. (2001) is highlighted with asterisks. Since we did not observe any conflict, this corresponds to those branches with at least three insertions. Species names in bold letters are the three genome assemblies that were used as starting points for CR1 presence/absence screenings; names in red letters refer to higher-ranking taxa. Note that despite the fact that crocodilians diverged from their avian outgroup more than 219 Ma (Shedlock and Edwards 2009), making it difficult to align neutrally evolving DNA, we identified four CR1 markers for crocodilian monophyly. These could be aligned with chicken and zebra finch sequences, where they exhibit an orthologous insertion site without the CR1 insertion.

