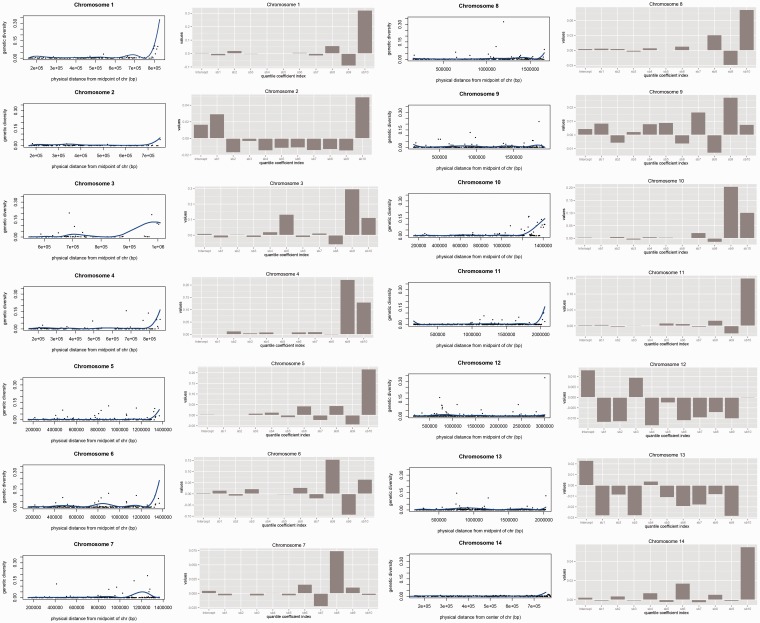
Fig. 3.—
Distribution of synonymous polymorphism genome wide in Plasmodium vivax along each chromosome, from the center of the chromosomes (origin of X axis) to the subtelomeric regions (far right of X axis, on first and third panels). The blue lines are fitted B-splines that resulted from the best quantile regression fitting over the median of the genetic diversity as a function of their chromosomal position of the genes. It is noticeable the larger genetic polymorphism towards the end of chromosomes 1,2,3,4,5,8,9,10,11, and 14 of P. vivax. The regression coefficients for each one of the ten equally spaced intervals for the B-spline, as well as the intercept are shown as barplots in the second and fourth panels. Significance for each coefficient estimated from randomization tests is shown in the supplementary material.

