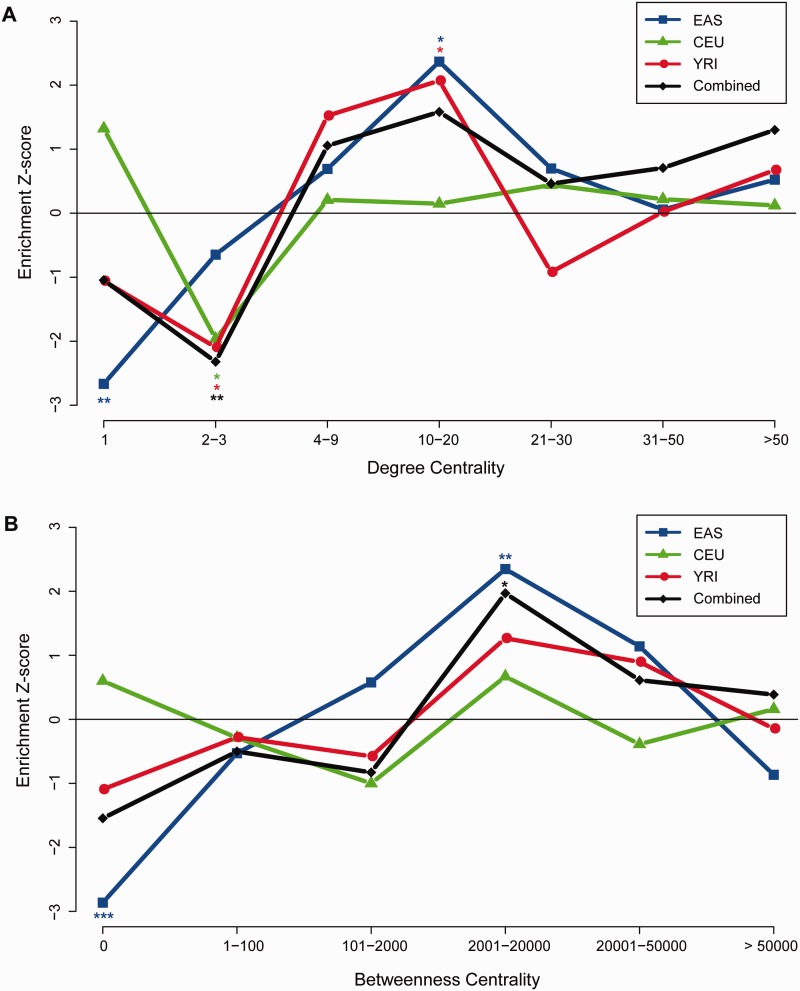
Fig. 2.—
Distribution of signals of recent positive selection on different positions of the human PPI network. (A) Distribution conditioned on DC. (B) Distribution conditioned on BC. In both plots, the x axes represent different intervals of centralities, either as DC scores in (A) or as BC scores in (B). The y axes represent the Z-scores of proportions of recent positive selection against null distribution of 10,000 random samplings. Lines in different color represent different populations. EAS, Han Chinese and Japanese; CEU, Europeans; YRI, Yorubans; combined, combination of the three populations. * indicates P-values < 0.05, ** < 0.01, and *** < 0.001.

