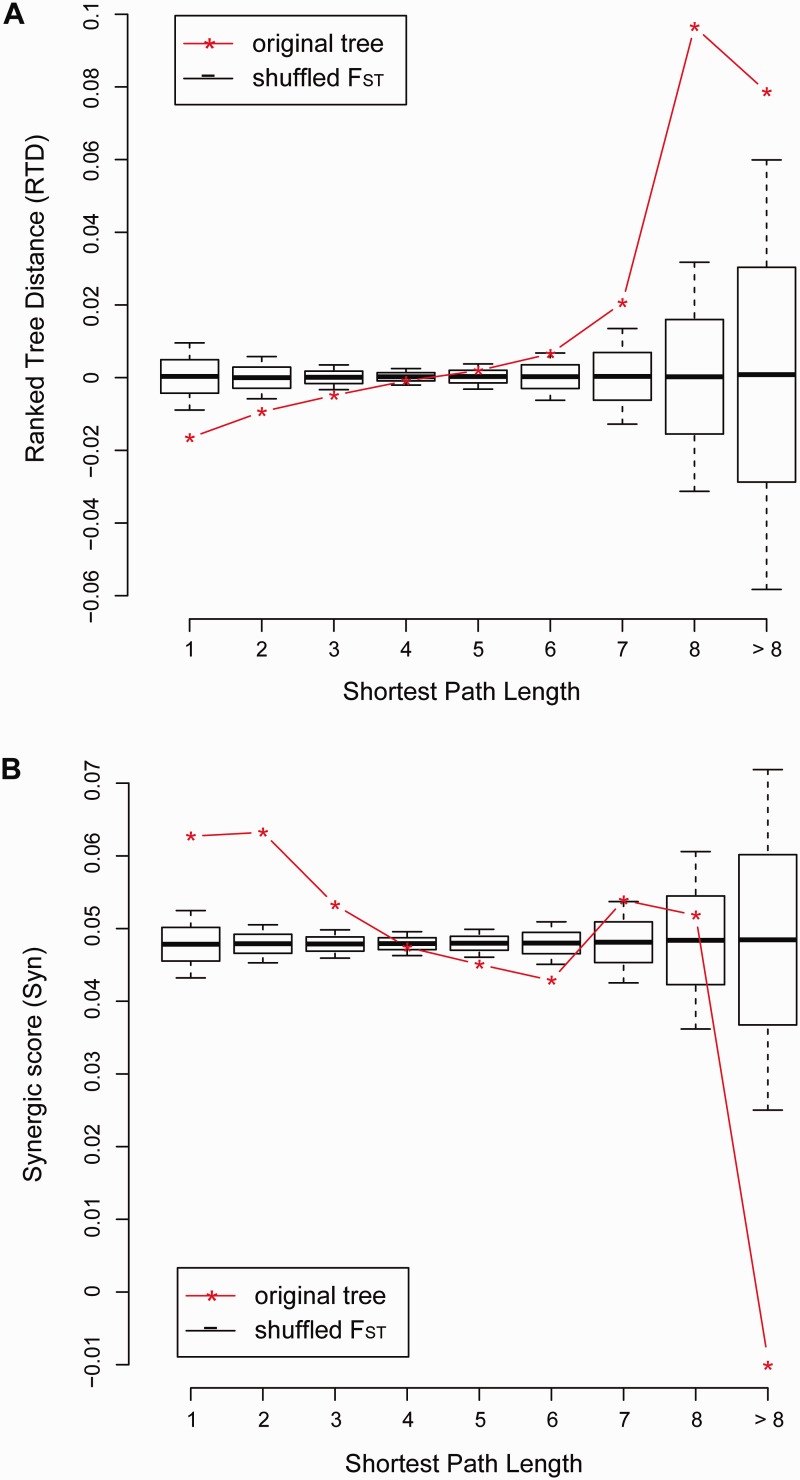
Fig. 4.—
The dependence on PPI network distance of similarities in trifurcate divergence trees between two genes. The similarity of trifurcate divergence trees was calculated either as (A) the ranked tree differences (RTD) or (B) the Syn score for pairs of genes. The average RTD or Syn scores was plotted against the SPL values, shown as star-linked red lines, and compared with the null distributions generated by random reshuffling as shown by box-plots where the solid black lines represent the expected value of RTD or Syn score for pairwise genes.

