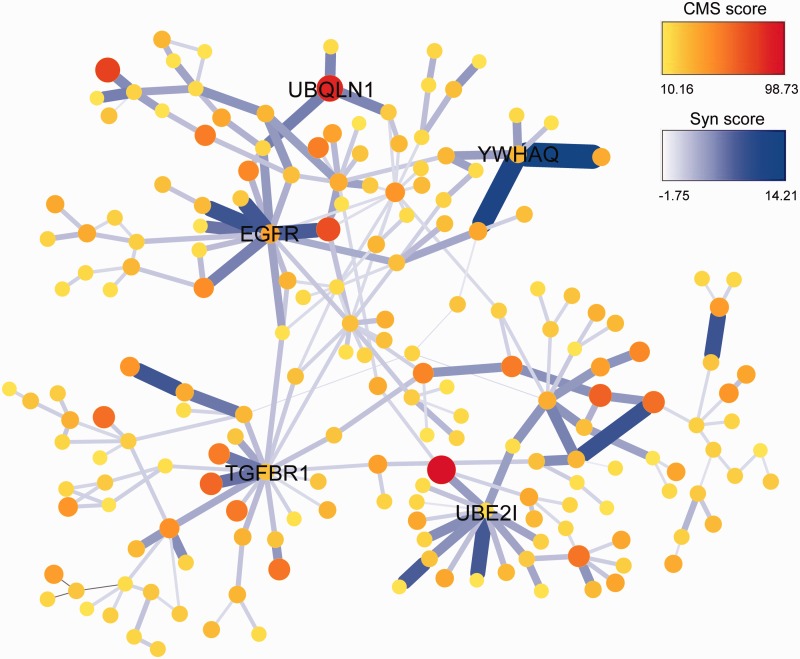
Fig. 5.—
The biggest subnetwork of coselection constituted by signals of recent positive selection in East Asians. The color and size of each vertex is proportional to the corresponding CMS score, whereas the color and thickness of each edge is proportional to Syn score of the interacting pair of proteins. Obvious hub genes are labeled with gene symbols.

