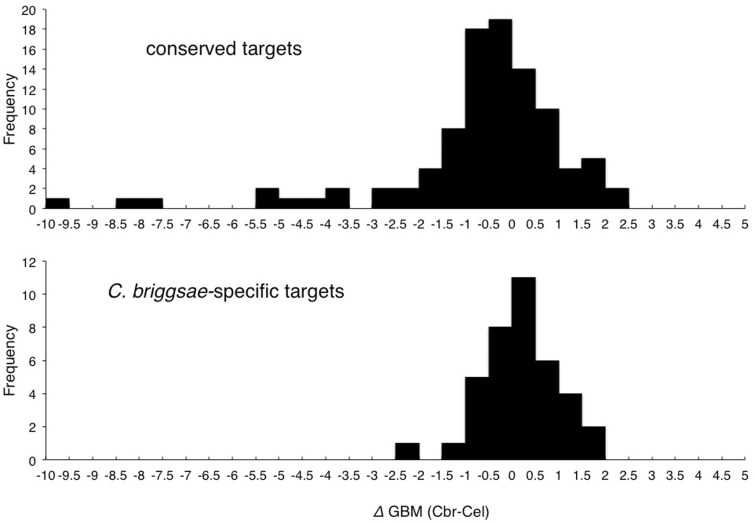
Fig. 5.—
Relationship between GBMs and species-specific GLD-1 association. Each histogram depicts the difference in total GBM density (deltaGBM) between Caenorhabditis elegans and C. briggsae ortholog pairs. Only genes with annotated C. elegans 5′- and 3′-UTRs are included. Upper panel: Cases where both homologs were identified as GLD-1 targets. Lower panel: Cases where the transcript is associated with Cbr-GLD-1 in this study, but whose C. elegans ortholog is not reported as associated with Cel-GLD-1 and is also expressed at over 100 FPKM in XX C. elegans animals. Omitting the long left tail of the distribution for the conserved targets, the remaining Cbr-GLD-1-specific transcripts still have a significantly higher (deltaGBM values; two-tailed T-test, P = 0.035).

