Fig. 6.—
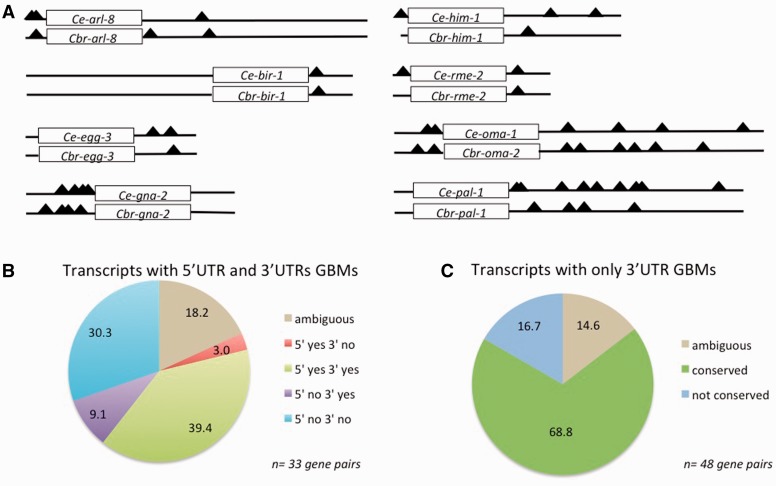
Conservation of GLD-1-binding sites among orthologous GLD-1 targets. (A) Location of GBMs (black triangles, as given in supplementary table S13, Supplementary Material online) within the untranlslated regions of eight representative orthologous GLD-1 target transcript pairs, illustrating different patterns of GBM conservation. For each transcript, the rectangle represents the open reading frame (not drawn to scale), whereas the lines to the left and right represent the 5′- and 3′-UTRs, respectively, and are drawn to scale. (B, C) Bulk analysis of GBM conservation in transcripts that are GLD-1 associated in both Caenorhabditis elegans and C. briggsae. (B) Inferred conservation of GBMs in orthologous genes for which at least one ortholog of each pair possesses a GBM in its 5′-UTR. (C) Inferred conservation status of GBMs for cases where both orthologs only possess GBMs in their 3′-UTR. In both (B) and (C), “ambiguous” cases include orthologs containing GBMs beyond our 15-bp cutoff (though these sites may be identical or nearly identical in base pair composition) and/or where less than 50% of the sites in any particular UTR have a counterpart in the orthologous UTR. “yes” and “no” indicate conservation or nonconservation, respectively, of GBMs in the indicated region of the transcript. Four ortholog pairs in which one member completely lacks identifiable GBMs are not included in this figure (see text).

