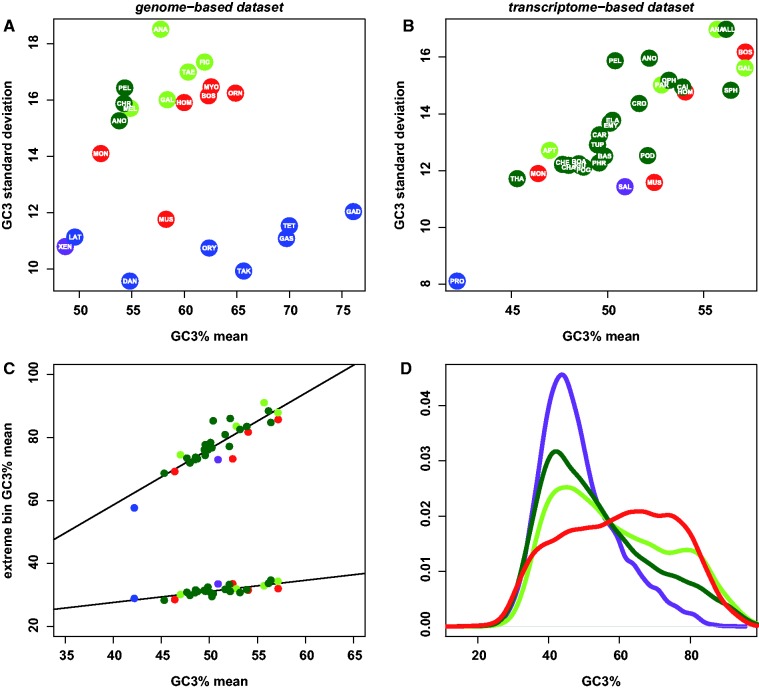
Fig. 1.—
Distribution of GC3 across genes and species in vertebrates. (A) Relationship between across-genes GC3 average and standard deviation: Genome-based data set; each dot is for a species; blue, bony fish; purple, amphibians; red, mammals; light green, birds; dark green, nonavian reptiles; for species name abbreviations, see Materials and Methods. (B) Relationship between across-genes GC3 average and standard deviation: Transcriptome-based data set; same legend as above. (C) Relationship between GC3 average of the 10% poorest (bottom-most regression) and 10% richest (uppermost regression) genes and GC3 average. (D) Distribution of gene GC3 in green anole (dark green), chicken (light green), human (red), and clawed frog (purple): Genome-based data set.

