Fig. 3.—

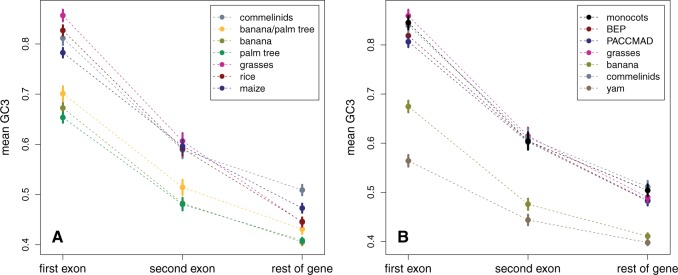
Mean GC3 (with 95% confidence interval) in the first exon, second exon, and rest of the gene for various lineages in the first set of species (A) or in the second set of species (B).

Mean GC3 (with 95% confidence interval) in the first exon, second exon, and rest of the gene for various lineages in the first set of species (A) or in the second set of species (B).