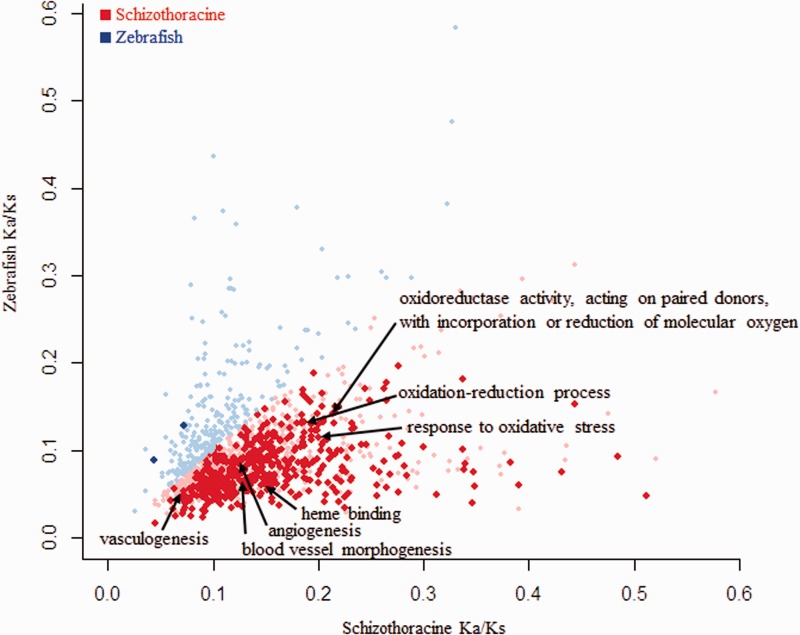
Fig. 3.—
Scatter plot of mean Ka/Ks ratios for each GO category in G. pachycheilus and zebrafish. GO categories with significantly higher mean Ka/Ks ratios in G. pachycheilus (red) and zebrafish (blue) are highlighted. Light red and light blue points represent the GO categories with higher but not statistically significant mean Ka/Ks ratios in G. pachycheilus and zebrafish.

