Fig. 3.—

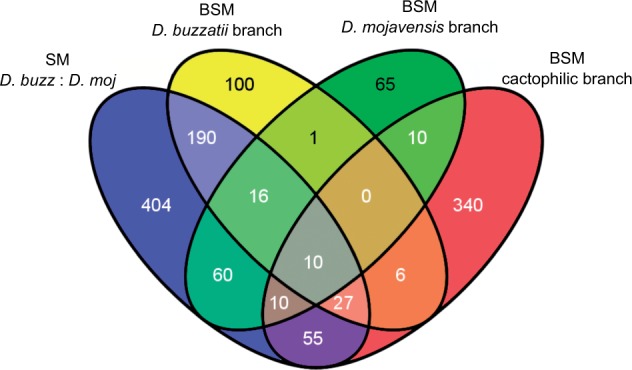
Venn diagram showing the number of genes putatively under positive selection detected by two different methods, SM and BSM using three different lineages as foreground branches.

Venn diagram showing the number of genes putatively under positive selection detected by two different methods, SM and BSM using three different lineages as foreground branches.