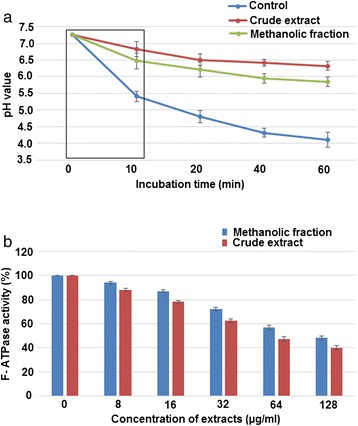
Figure 3.

Inhibitory effect on acid production and adaptation. Effect of sub-MIC concentration (128 μg ml−1) of CR extract and ME fraction on (a) glycolytic pH-drop (the values enclosed in box corresponds to the initial rate of the pH drop) (b) F- ATPase activity.
