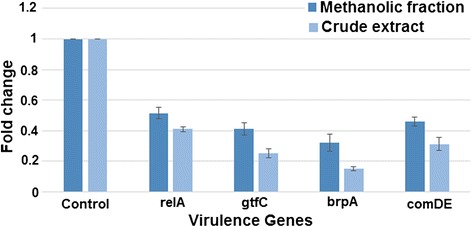
Figure 7.

Relative quantification of selected virulent genes expression by quantitative RT-PCR. Expression profile by real time PCR of various virulence genes of S. mutans in response to the treatment with sub- MIC levels of extracts. Each value is an average of triplicate assays. Data are means ± SD (n = 3).
