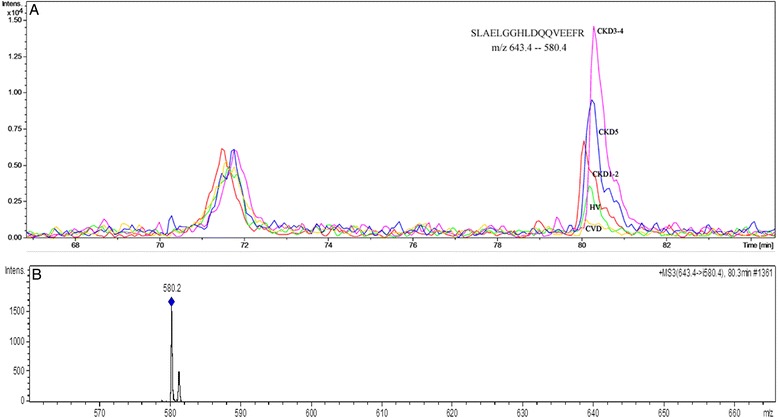
Figure 5.

An example of the SRM analysis of APOA4. A. The extracted ion chromatograms of the SRM transitions of the SLAELGGHLDQQVEEFR peptide of APOA4 in HV, CKD1-2, CKD3-4 and CVD plasma. B. The MS/MS spectrum of the transition 643.4 - > 580.4 m/z (parent mass - > fragment mass).
