
Figure 2.
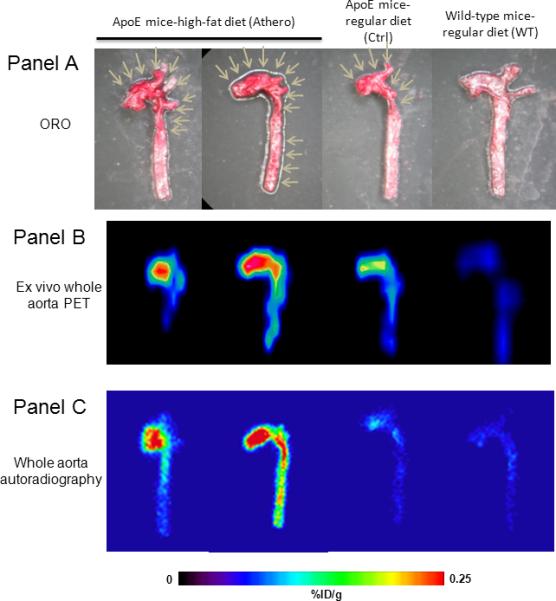
Flotegatide uptake by atherosclerotic plaque in whole aorta in Athero, Ctrl and WT mice
Panel A: The aorta was excised and the lumen was exposed. ORO staining was performed as described in the methods. ORO staining of Athero, WT and Control mice is shown. Arrows point to focal areas enriched for plaque in the aortic arch.
Panel B: Aorta explanted from Athero, WT and Control mice was subjected to ex-vivo PET as described in the methods 1 h after injection of 18F-Flotegatide. The signal intensity is a reflection of tracer uptake; areas of high uptake appear red compared to areas of low uptake which appear blue with intermediate uptake in yellow and green.
Panel C: Aorta explanted from Athero, WT and Control mice was subjected to autoradiography as described in the methods 1 h after injection of 18F-Flotegatide. Tracer uptake is represented by the signal intensity from the digital readout using a FLA-7000 scanner. Areas of high uptake appear red compared to areas of low uptake which appear blue with intermediate uptake appearing yellow and green.