
Figure 5A.
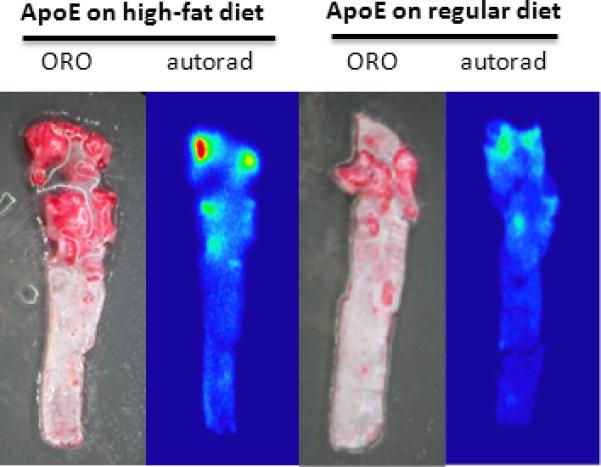
ORO staining and autoradiography of whole aorta from Athero and control mice. ORO staining and autoradiography was performed as described previously after excision of aorta from Athero and control mice. The dark red regions on the ORO staining correspond to focal atheroma. The red, yellow and green regions on the autoradiograph represent plaque with increased 18F-Flotegatide uptake.