Figure 1.

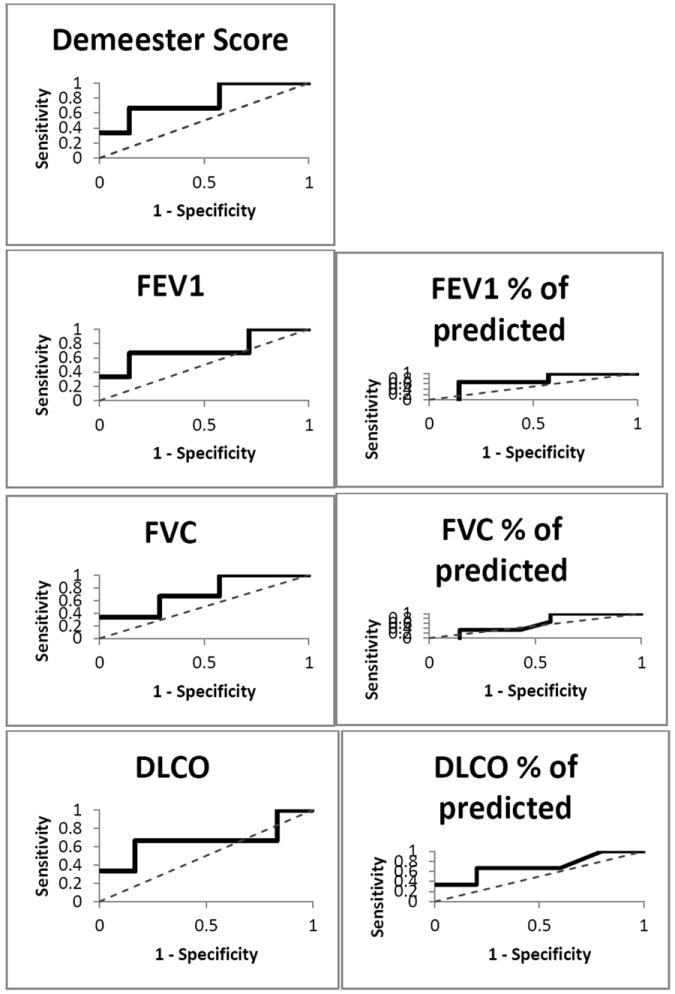
ROC curves for DeMeester score, FEV1, %predicted FEV1, FVC, %predicted FVC, DLco, and %predicted DLco. The curves show the differences from the 45-degree line of no discrimination, indicating the accuracy of tests at predicting survival.

ROC curves for DeMeester score, FEV1, %predicted FEV1, FVC, %predicted FVC, DLco, and %predicted DLco. The curves show the differences from the 45-degree line of no discrimination, indicating the accuracy of tests at predicting survival.