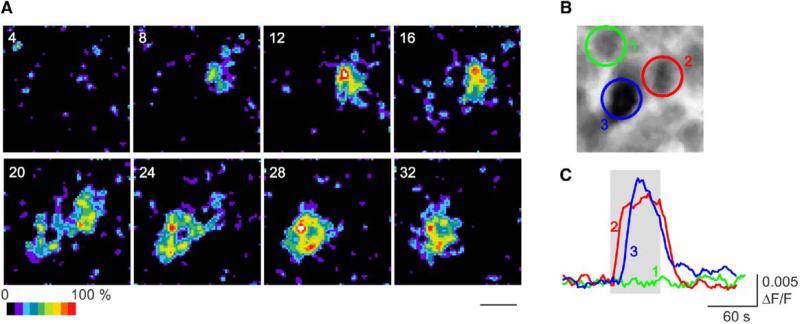
Figure 2. Light Responsiveness at Birth.
(A) and (B) Series of sequential images (acquired every 4 s) depicting the change in fluorescence in a group of cells (B) during 470 nm stimulation (applied at time point 0; 2.9 × 10¹⁵ photons/s/cm2; see also Movie S3). The scale bar represents 10 μm.
(C) Traces of the change in fluorescence in three cells in this preparation. Cell 1 showed no fluorescence change during light stimulation, whereas cells 2 and 3 demonstrated significant light-evoked increases in fluorescence.

