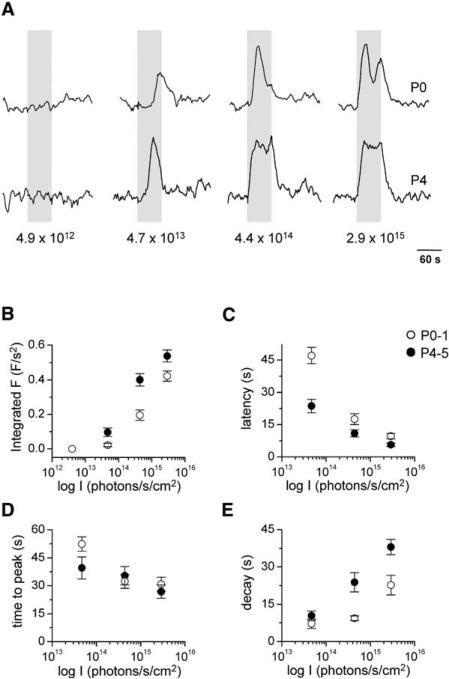
Figure 4. Developmental Changes in Light Sensitivity.
(A) Typical examples of the change in fluorescence in a cell from a P0 retina and in a cell from a P4 retina after application of increasing intensities of 470 nm stimulation. Responses have been normalized to the maximum response amplitude for each cell.
(B) Intensity dependence of the total change in fluorescence during light stimulation in cells from P0–1 (open circle) and P4–5 (closed circle) retinae. Significant differences between the responses from P0–1 and P4–5 cells were observed (p < 0.05 at 4.7 × 10¹³–2.9 × 10¹⁵ photons/s/cm2).
The intensity dependence of the response latency (C), time to peak (D), and response decay (E) are plotted for P0–1 and P4–5 light responses. Significant differences between the P0–1 and P4–5 data were found for the latency (p < 0.05 at 4.7 × 10¹³–2.9 × 10¹⁵ photons/s/cm2) and decay (p < 0.05 at 4.4 × 10¹⁴–2.9 × 10¹⁵ photons/s/cm2) parameters. There was no age-dependent difference in the time-to-peak data. All data are presented as mean ± SEM.

