Abstract
The serotonin-1A (5-HT1A) receptor is implicated in an array of neurological and psychiatric disorders. Current PET radioligands targeting 5-HT1A receptors have limitations hindering widespread PET studies of this receptor system. The 5-HT1A specific antagonist radioligand N-{2-[4-(2-methoxyphenyl)piperazinyl]ethyl}-N-(2-pyridyl)-N-(trans-4-18F-fluoromethylcyclohexane)carboxamide (18F-mefway) exhibited promising in vivo properties in rhesus monkeys. The goal of this work was to examine the in vivo cerebral binding profile and metabolism of 18F-mefway in humans.
Methods
Dynamic 18F-mefway PET data were acquired for six healthy volunteers (4F, 2M; 22–38 years). Scans were initiated with the injection of 192–204 MBq radiotracer and data were acquired for two hours. Venous blood samples were collected and assayed to examine the in vivo metabolism profile of 18F-mefway. To examine the test-retest variability of 18F-mefway, a second PET scan was acquired at least two weeks later for four subjects. Regional binding potentials (BPND) were calculated with MRTM, and voxel-wise BPND maps were calculated with Logan graphical analysis. Regions surrounding the brain were carefully inspected for uptake of radiolabeled species in bone.
Results
18F-Mefway uptake in the brain occurred quickly with peak SUVs of 1.7. Rapid washout in the cerebellum resulted in SUVs of 0.2 at 120 minutes, while regions with specific 5-HT1A binding exhibited retention of radioligand yielding SUVs of 0.4–0.9 at 120 minutes. Rapid metabolism of 18F-mefway was observed, with no detected 18F-fluoride ions in plasma. BPND values of 2.4 were measured in the mesial temporal lobe, with values of 1.6 in insular cortex and 0.7–1.0 in other cortical regions. Stable BPND estimates were obtained using 90 minutes of dynamic data. Average test-retest variability was 8%. No evidence of radioactivity uptake in bone was observed.
Conclusion
18F-Mefway exhibits favorable in vivo properties for serotonin 5-HT1A receptor measurements in humans. The simple radiosynthesis, high specific binding profile, and absence of PET signal in bone make 18F-mefway an attractive radiotracer for PET experiments examining the 5-HT1A receptor in neuropsychiatric disorders and drug intervention.
Keywords: PET, 18F-mefway, serotonin-1A, hippocampus
Introduction
The neurotransmitter 5-hydroxytryptamine (5-HT; serotonin), is a crucial regulator of many cognitive processes including memory, learning, and mood. The 5-HT1A receptor is a G-protein coupled receptor that plays a vital role in regulating 5-HT transmission. These receptors occur presynaptically as autoreceptors in the raphe nuclei (1) and postsynaptically in cortical and hippocampal regions (2). Brain regions rich in 5-HT1A receptor concentrations include the mesial temporal lobe, cingulate cortex, raphe nuclei, frontal cortex, and parietal cortex. The 5-HT1A receptor is implicated in a variety of neuropsychiatric pathologies, including schizophrenia, Alzheimer’s disease, depressive disorders, and alcohol dependence.
An important experimental technique for in vivo interrogation of 5-HT1A receptors is positron emission tomography (PET) imaging. To date, the most commonly used PET antagonist radioligand for 5-HT1A receptors is 11C-WAY-100635 (3). This radioligand exhibits high signal in regions of specific binding relative to the cerebellum and suitable BPND quantification, however, widespread use of this radioligand has been limited. The radiochemical production for 11C-WAY-100635 is difficult to reliably perform, while the short 20 minute half-life of the 11C label requires an on-site cyclotron and yields poor counting statistics towards the end of scanning procedures. To overcome these issues, a variety of WAY-100635 analogs with the longer lived 18F label (110 minute half-life) have been developed (for review see 4). 18F-MPPF has been successfully used to study 5-HT1A physiology in human subjects, but suffers from poor brain penetration and subsequently yields low target-to-background ratios (5). 18F-FCWAY has kinetic properties similar to 11C-WAY-100635 and a simple labeling procedure (6). However, defluorination of 18F-FCWAY in vivo resulted in bone uptake of 18F-fluoride ions, complicating analysis of PET data (7) and requiring enzyme inhibitors to enable suitable quantification (8).
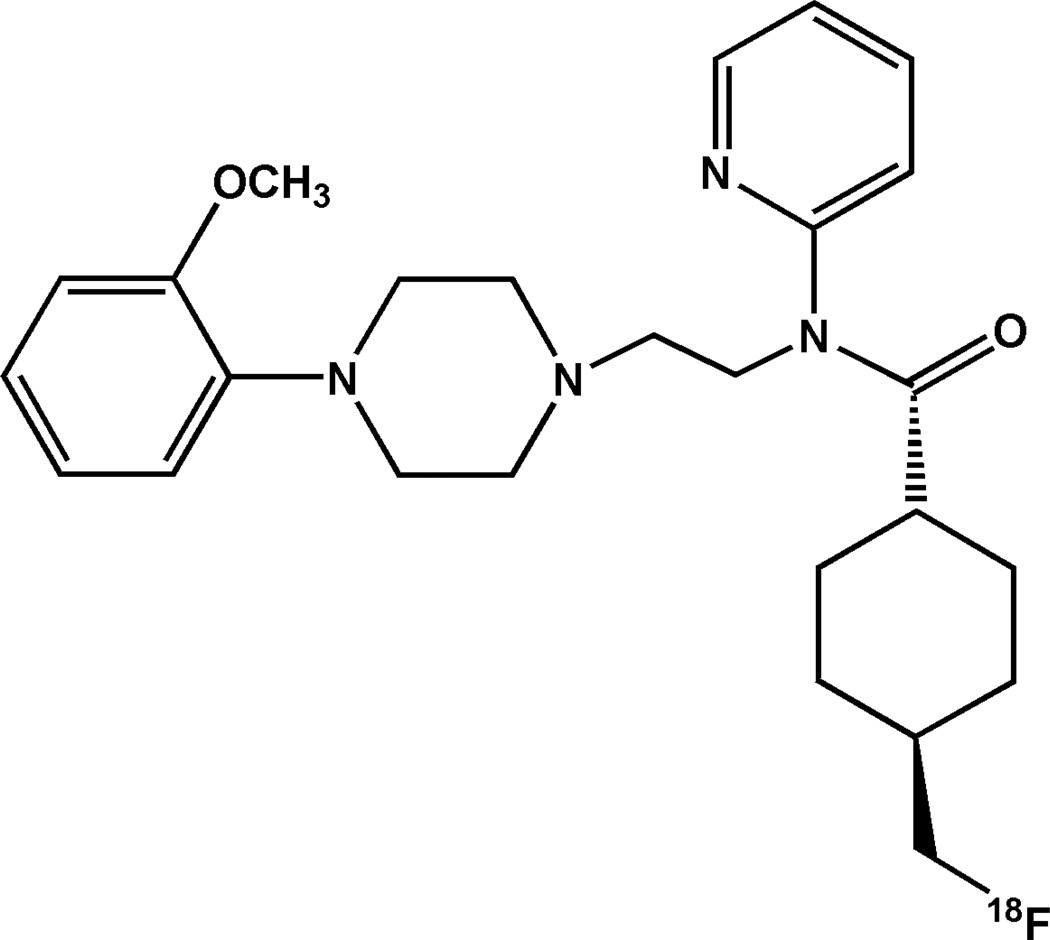
The radioligand N-{2-[4-(2-methoxyphenyl)piperazinyl]ethyl}-N-(2-pyridyl)-N-(4-18F-fluoromethylcyclohexane)carboxamide was designed to provide an 18F labeled analog of 11C-WAY-100635 with improved stability by moving the radiolabel from an aromatic ring to a primary carbon. Studies of the cis- and trans- isomers of this radioligand revealed high specificity of the trans isomer for 5-HT1A receptors (9), therefore this human study focused on the trans isomer, shown in Figure 1 (henceforth abbreviated as 18F-mefway). 18F-Mefway is produced with high yields (10), and preclinical experiments demonstrated comparable kinetic properties between 11C-WAY-100635 and 18F-mefway in rhesus monkeys with no evidence of defluorination (11).
Figure 1.
Chemical structure of trans-18F-Mefway.
Studies investigating 5-HT1A receptor physiology in nonhuman primates using 18F-mefway have also been performed in our labs. These findings include sex-based differences in 5-HT1A function, where increased in vivo affinity of 18F-mefway for the 5-HT1A receptor and decreased 5-HT1A binding potentials in females relative to males were observed (12). Additionally, decreased 5-HT1A binding levels in 5-HTTLPR s-carriers (13), and increased 5-HT1A binding levels following chronic alcohol self-administration have been reported (14). These 18F-mefway studies therefore indicated great promise of a suitable 18F-labeled radioligand to image 5-HT1A specific physiology in humans.
The goal of this work was to evaluate the in vivo properties of 18F-mefway in humans for the first time. The regional distribution of 18F-mefway uptake and binding in the human brain is reported, including a detailed inspection of 18F-mefway binding in the important high 5-HT1A density region of the mesial temporal lobe. Furthermore, a preliminary analysis of 18F-mefway’s behavior in venous plasma samples is performed.
Materials and Methods
Subjects
Subjects were healthy volunteers consisting of four females and two males, ranging in age from 22–38 years, recruited at the University of Wisconsin-Madison. The University of Wisconsin Institutional Review Board approved all study procedures. All subjects provided informed signed consent before participation. Anti-depressive medication was verbally screened for as an exclusion criterion.
Scanning Procedures
18F-Mefway was produced following previously published methods (9). The synthesis consisted of a nucleophilic substitution of the precursor, N-{2-[4-(2-methoxyphenyl)piperazinyl]ethyl}-N-(2-pyridyl)-N-(trans-4-tosyloxymethylcyclohexane)carboxamide (tosyl-trans-mefway; Huayi Isotopes), with cyclotron-produced 18F-fluoride ions at 96° C to synthesize 18F-mefway. Reverse-phase C18 HPLC purification with a mobile phase of 50:50:0.1 MeCN:H2O:TEA was then performed. Solvents were removed via C18 sep-pak extraction. The final product was formulated in 9 mL sterile saline and 1 mL EtOH, and filter sterilized.
18F-Mefway PET data were acquired on a Siemens EXACT HR+ PET scanner using 3-D mode. A six minute transmission scan using 68Ge rod sources was first acquired for attenuation correction. Dynamic PET data acquisition was initiated with a bolus injection of 192–204 MBq 18F-mefway, and data were acquired for 120 minutes. Venous samples of 1.0 mL were acquired from the cephalic vein (opposite the injection arm) approximately 5, 15, 30, 60, 90, and 120 minutes postinjection. At least two weeks after the first scan, five of the six subjects returned for a second 18F-mefway scanning procedure to assess the test-retest reproducibility of 18F-mefway imaging. The mean and standard deviation of the administered mass of 18F-mefway was 56±50 ng (range, 12–143 ng). The mean administered activity of 18F-mefway was 199±4 MBq (range, 192–204 MBq). There were no adverse or clinically detectable pharmacologic effects, including no significant changes to vital signs or laboratory results, in any of the 6 subjects.
MRI data were acquired on a GE 3.0 T MR750 (Waukesha, WI) with an 8 channel head coil. A T1-weighted SPGR volume was acquired using the following parameters: TI/TE/TR=450ms/3.2ms/8.2ms, flip angle=12°, slice thickness=1mm no gap, FOV=256, matrix size=256×256.
Data Processing and Analysis
Venous blood samples were analyzed to assay 18F-mefway metabolism in vivo. Samples of 1.0 mL whole blood mixed with 50 µL heparinized saline were centrifuged for 5 minutes. Next, 0.5 mL plasma was extracted and mixed with 50 µL 5.5% sodium bicarbonate and 0.5 mL acetonitrile, followed by vigorous mixing to denature the proteins. After the protein precipitate settled, 0.5 mL liquid was extracted, concentrated, and spotted on an alumina TLC plate (Whatman). The TLC was developed in a mobile phase of 50:50 MeOH:10% ammonium acetate and subsequently exposed to a phosphor plate to quantify parent 18F-mefway present in the blood. The phosphor plate was read by a Cyclone storage phosphor system (PerkinElmer) and analyzed with OptiQuant software. The plasma free fraction (fP) was measured with Centrifree ultrafiltration units (Millipore).
PET data were histogrammed into frames of 8×0.5 minutes, 3×2 minutes, 10×5 minutes, and 6×10 minutes. Sinogram data were then reconstructed with a filtered back projection algorithm (Direct Inverse Fourier Transformation) using a 4 mm gaussian filter and included corrections for random events, deadtime, signal attenuation, and scanner normalization. Final images had dimensions of 128×128×63, corresponding to voxel dimensions of 2.57 mm × 2.57 mm × 2.43 mm. Images of PET data summed from 1–10 minutes postinjection, reflective of diffuse radioligand delivery throughout the brain, were used to register PET frames to the native space of the corresponding MRI image using FSL’s Linear Image Registration Toolbox (FLIRT; 15). The affine matrix was constrained to a rigid body transformation (6 d.o.f.) since no intrasubject normalization was imposed.
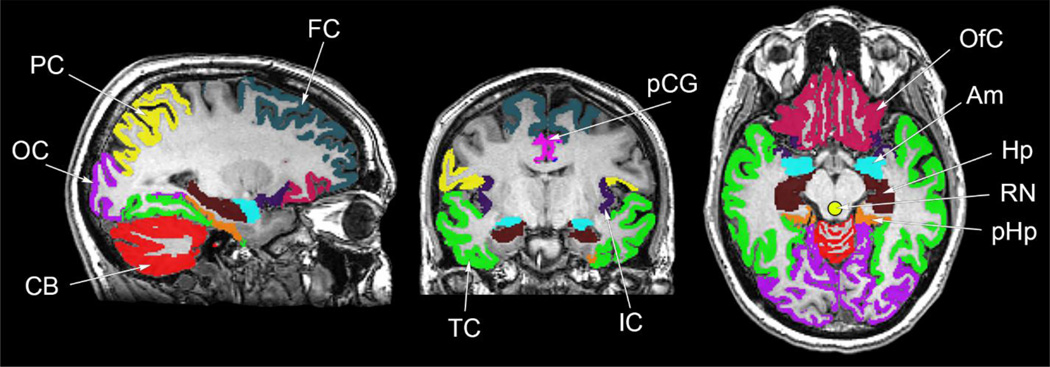
Regions of interest were defined with FreeSurfer 5.3 software (http://surfer.nmr.mgh.harvard.edu). Regions extracted with this template-based algorithm included the amygdala, hippocampus, parahippocampal gyrus, insular cortex, anterior cingulate gyrus, posterior cingulate gyrus, parietal cortex, orbitofrontal cortex, temporal cortex, occipital cortex, and frontal cortex, shown in Figure 2. Additionally, the raphe nuclei region was manually drawn for each PET scan since this region’s structure cannot be accurately determined based on MRI data. To observe radioligand kinetic properties in regions of highest 18F-mefway binding, PET data from a manually defined region of focal uptake in the mesial temporal lobe were also analyzed. This region included areas of the hippocampus proper, subiculum, dentate gyrus, and amygdala, and was hand drawn to minimize imperfect PET to MRI coregistration and partial volume effects. Time activity curves were extracted from all regions for subsequent analysis.
Figure 2.
Regions used for analysis of 18F-mefway PET data. Regions defined by the template-based FreeSurfer algorithm included the amygdala (Am), hippocampus (Hp), parahippocampal gyrus (pHp), insular cortex (IC), anterior cingulate gyrus (aCG; not shown), posterior cingulate gyrus (pCG), parietal cortex (PC) orbitofrontal cortex (OfC), temporal cortex (TC), occipital cortex (OC), frontal cortex (FC). The hand drawn raphe nuclei (RN) is also shown.
To compare measured cerebral radioactivity concentrations with other radioligands, standardized uptake value (SUV) was calculated as SUV = PET/i.d.* mass*1000, where PET is the measured PET concentration (kBq/cc), i.d. is the injected dose (kBq), and mass is subject mass (kg). To quantify specific 18F-mefway binding, binding potential based on nondisplaceable uptake (BPND) was measured. BPND is an index of receptor binding proportional to the product of receptor density and radioligand-receptor affinity (BPND=fNDBmax/KDapp; 16). Regional 18F-mefway BPND values were calculated with the Multilinear Reference Tissue Model (MRTM; 17), assuming the cerebellum as a reference region. Logan graphical analysis (18) was used to calculate BPND values for comparison with the MRTM method and to visualize the establishment of radioligand psuedoequilbirum. Voxel-wise 18F-mefway BPND maps were also produced with Logan graphical analysis.
To assess the test-retest reproducibility of 18F-mefway binding, early PET data from the retest scans (1–10 minutes postinjection) were coregistered to the space of the test PET scan, allowing for 6 degrees of freedom. The affine matrix transforming the test PET data to the MRI was then applied to the retest PET data. TACs were extracted and regional BPND values using MRTM were calculated as described above. The test-retest variability (TRV) between test and retest BPND values expressed as a percentage was calculated for each region with the relationship TRV=Abs{(BPND(Test)−BPND(Retest))/(BPND(Test)+BPND(Retest))/2}*100. Additionally, the intraclass correlation coefficient (ICC; 19) was calculated for each region.
Results
Radiochemistry
18F-Mefway was produced with high yields >1 GBq with specific activities >400 MBq/nmol. Radiochemical purity was 98.7±2.8%, with chemical purities and stability >90% at time of expiration.
18F-Mefway in Plasma
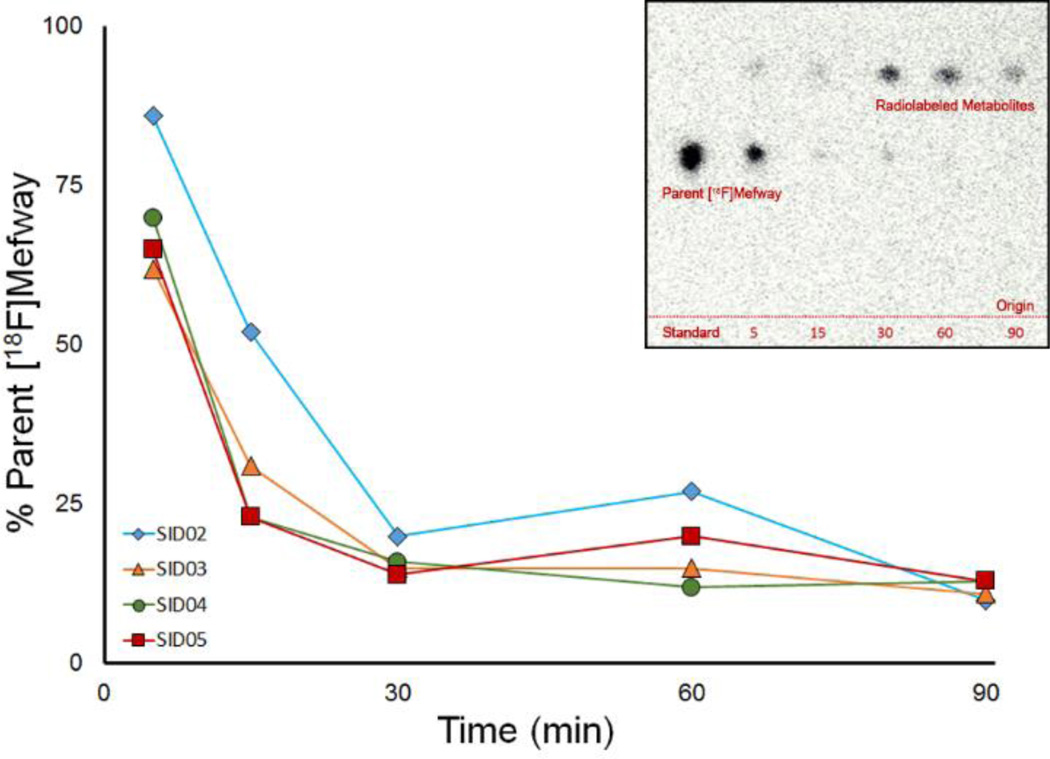
Venous blood samples were acquired to characterize the in vivo metabolism of 18F-mefway. Acceptable radiochromatograms were only acquired for four subjects. Radio-TLC analysis of the plasma samples revealed the presence of radiolabeled metabolites as shown in Figure 3, although no attempt was made to assess any volatile species. The chemical nature of these metabolites were not characterized in the present work. Notably, no radiolabeled species were detectable at the origin of the chromatogram, suggesting negligible accumulation of 18F-fluoride ions in the blood.
Figure 3.
Metabolism of 18F-mefway in vivo. The main plot shows the percentage of total radioactivity in the plasma attributed to parent 18F-mefway. Each distinct color and shape corresponds to a separate subject. The inset presents a typical radiochromatogram. Note the absence of detectable radioactivity at the origin, the expected location of 18F-fluoride ion elution.
In vivo metabolism of 18F-mefway was initially rapid, with parent compound accounting for less than 20% of total plasma radioactivity 30 minutes postinjection. At this point, metabolism slowed, such that 10–15% of the radioactivity in the plasma was 18F-mefway at 90 minutes postinjection (see Figure 3). The fP of 18F-mefway, measured for five of the six subjects, was 5.1 ± 0.7%.
18F-Mefway Brain Uptake
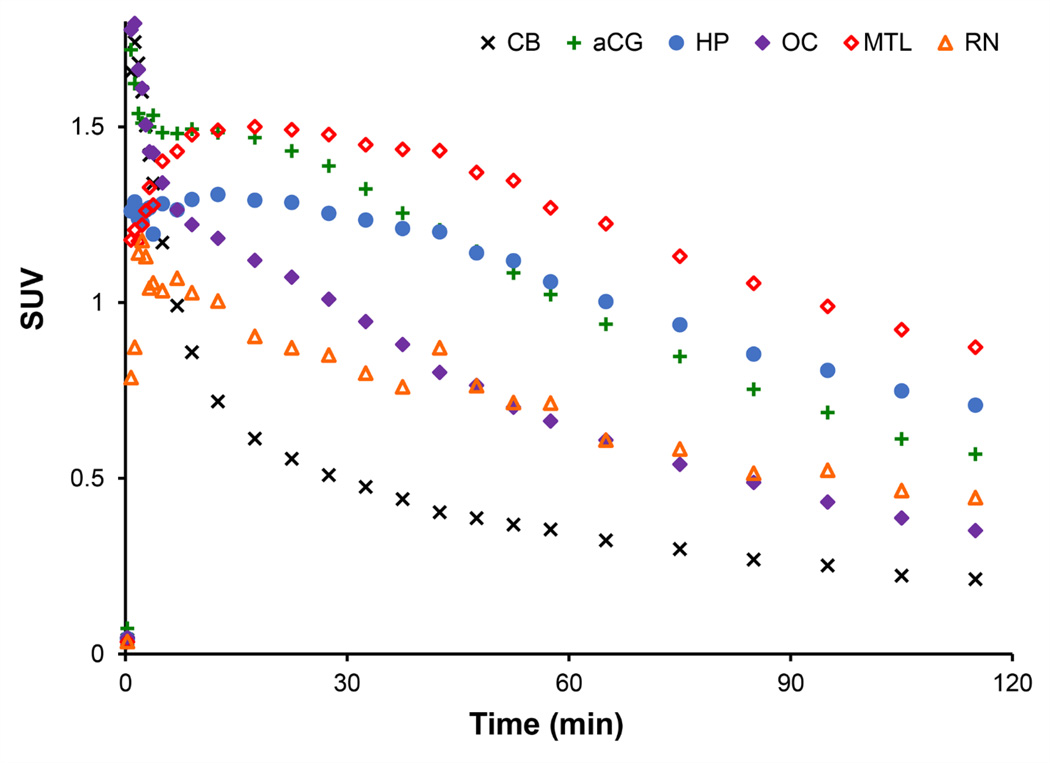
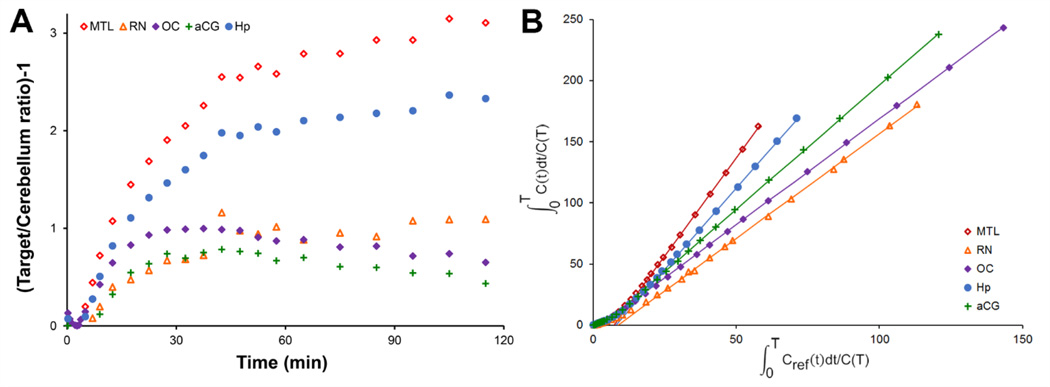
Time activity curves of 18F-mefway uptake in the brain are illustrated in Figure 4. The time course of 18F-mefway in the brain rapidly peaked at SUVs of roughly 1.7 after 1–2 minutes in the cerebellum and various cortical regions. Clearance of 18F-mefway was rapid in the cerebellum, decreasing to half the peak value within 10 minutes postinjection and approaching SUVs of 0.2 at 120 minutes postinjection. In regions of high specific 18F-mefway uptake, such as the mesial temporal lobe and hippocampus, peak uptake of 18F-mefway was slower, plateauing within 15–20 minutes postinjection with very slow decreases in PET signal, reflective of specific 18F-mefway binding. As illustrated in Figure 5A, ratios of 18F-mefway concentrations in hippocampal regions relative to the cerebellum plateaued after roughly 60–90 minutes postinjection at ratios ranging from 2 to 4.5. In cortical regions, these ratios plateaued faster with lower peak ratio values.
Figure 4.
Representative 18F-mefway time-activity curves. SUVs are defined as SUV = PET/i.d.* weight*1000. Regions shown include focal areas of uptake in the mesial temporal lobe (MTL,  ); hippocampus (Hp,
  ); anterior cingulate gyrus (aCG,
  ); raphe nuclei (RN,
  ); occipital cortex (OC,
  ); and cerebellum (CB, ×).
Figure 5.
Kinetic properties of 18F-mefway in vivo. A shows 18F-mefway target/cerebellum ratios. B illustrates Logan plots, with t*=45 minutes, to visualize pseudoequilibrium of the tracer in various regions of the brain. Regions shown include focal areas of uptake in the mesial temporal lobe (MTL,  ); hippocampus (Hp,
  ); anterior cingulate gyrus (aCG,
  ); raphe nuclei (RN,
  ); and occipital cortex (OC,
  ).
).
Specific 18F-Mefway Binding
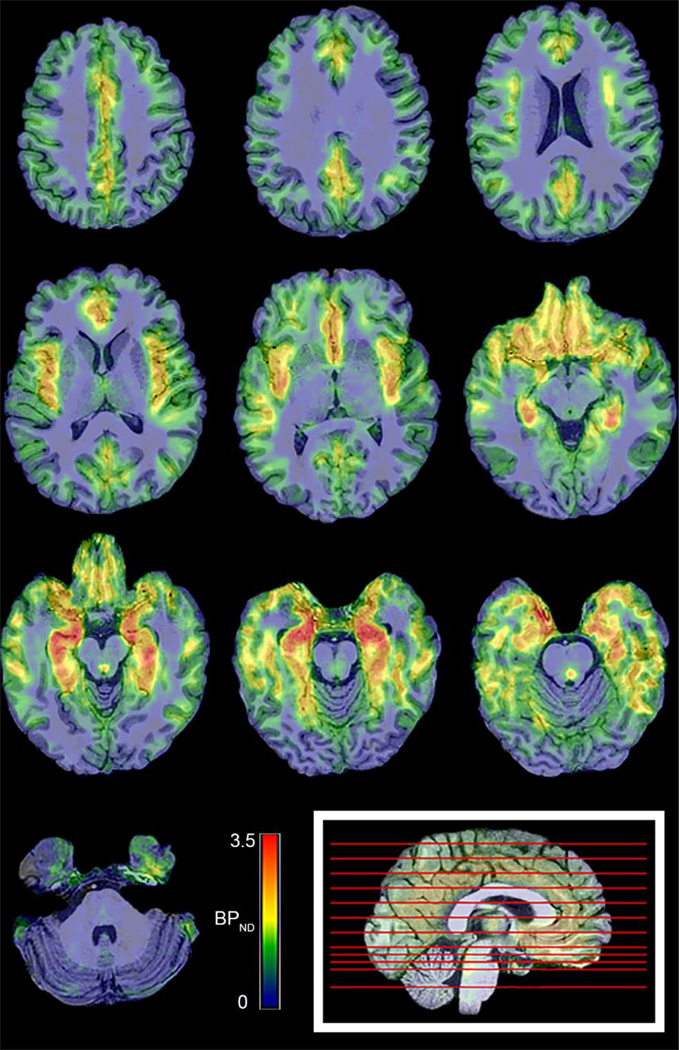
Estimates of BPND generated with MRTM2 for all regions examined are presented in Table 1. The highest values were observed in the MTL (2.42 ± 0.46). Estimates of BPND generated with the Logan reference region analysis method, using a linearization time t*=45 minutes and omitting the k̅2 term, agreed within 3% of the estimates with MRTM. Sample Logan plots are illustrated in Figure 5B, showing the linearization of the data in all regions by 45 minutes postinjection. A voxelwise BPND map, generated with Logan graphical analysis, is shown in Figure 6 for visualization of 18F-mefway specific binding.
Table 1.
Scan details and regional 18F-mefway BPND values with test-retest analysis
| Regional BPND# | |||||||||||||||||
|---|---|---|---|---|---|---|---|---|---|---|---|---|---|---|---|---|---|
| Subject | Sex | Age | Weight (kg) |
Injected Activity (MBq) |
MTL* | Hp | Am | pHp | IC | aCG | pCG | RN* | PC | OfC | TC | OC | FC |
| 1 | F | 27 | 89 | 204 | 2.59 | 2.08 | 1.14 | 1.74 | 1.61 | 1.08 | 0.86 | 0.94 | 0.73 | 1.08 | 1.27 | 0.63 | 0.77 |
| 2 | F | 27 | 79 | 192 | 2.23 | 1.67 | 1.12 | 1.65 | 1.53 | 1.07 | 0.73 | 0.72 | 0.95 | 0.88 | 1.39 | 0.75 | 0.99 |
| 3 | M | 32 | 113 | 200 | 3.15 | 2.65 | 2.08 | 2.24 | 2.19 | 1.83 | 1.54 | 1.56 | 0.80 | 1.68 | 1.31 | 0.79 | 0.81 |
| 4 | M | 22 | 97 | 204 | 1.86 | 1.14 | 0.52 | 1.27 | 1.27 | 0.71 | 0.51 | 0.37 | 0.87 | 0.85 | 1.27 | 0.64 | 0.79 |
| 5 | F | 38 | 114 | 196 | 2.63 | 1.85 | 1.03 | 1.80 | 1.40 | 1.13 | 0.85 | 0.80 | 0.72 | 1.02 | 1.20 | 0.66 | 0.73 |
| 6 | F | 38 | 58 | 196 | 2.07 | 1.11 | 0.72 | 1.10 | 1.52 | 1.50 | 0.87 | 0.59 | 1.27 | 1.31 | 1.51 | 0.89 | 1.37 |
| Mean (S.D.) | 2.42 (0.46) | 1.75 (0.59) | 1.10 (0.54) | 1.63 (0.41) | 1.59 (0.32) | 1.22 (0.39) | 0.89 (0.34) | 0.83 (0.41) | 0.89 (0.20) | 1.14 (0.31) | 1.32 (0.11) | 0.73 (0.10) | 0.91 (0.24) | ||||
| Test-Retest Variability (TRV) | 5.89 | 3.69 | 11.55 | 5.42 | 11.04 | 8.94 | 10.01 | 11.35 | 10.06 | 8.16 | 5.61 | 4.10 | 9.04 | ||||
| Intra-Class Correlation (ICC) | 0.94 | 0.99 | 0.99 | 0.95 | 0.88 | 0.98 | 0.98 | 0.97 | 0.60 | 0.96 | 0.43 | 0.88 | 0.71 | ||||
Denotes PET defined regions
BPND values calculated with MRTM.
Regions included are focal areas of uptake in the mesial temporal lobe (MTL; hand drawn), hippocampus (Hp), amygdala (Am), parahippocampal gyrus (pHp), insular cortex (IC), anterior cingulate gyrus (aCG), posterior cingulate gyrus (pCG), parietal cortex (PC) orbitofrontal cortex (OfC), temporal cortex (TC), occipital cortex (OC), frontal cortex (FC), and raphe nuclei (RN; PET defined).
Figure 6.
Voxel-Wise 18F-mefway BPND maps overlaid on a coregistered MRI image. Parametric BPND images are linearly scaled from 0 to 3.5. The location of each transverse slice is denoted by red lines on the mid-sagittal slice at bottom right.
Retest 18F-mefway scans were acquired for five subjects, however, one subject did not complete the scanning procedure, therefore only four retest scans were analyzed for test-retest analysis. For the four subjects with retest scans, the TRV averaged across all regions was 8% (Table 1). The ICC in regions of high 18F-mefway uptake was greater than 0.88, indicating substantial agreement (20). Lower values were measured in areas of moderate uptake, likely due to the reduced BPND values in these regions.
Discussion
This study demonstrates that 18F-mefway has favorable specific binding levels and kinetic properties favorable for human PET imaging of 5-HT1A receptors. Reliable imaging of the 5-HT1A system has been an important goal of the neuroimaging community, yet lack of a suitable radioligand has stunted successful widespread PET imaging of 5-HT1A receptors due to limitations in areas such as radiochemistry, quantitation, defluorination, and brain penetration. 18F-Mefway possesses a simple radiochemical production, brain uptake levels comparable to other 5-HT1A radioligands, high signal to noise ratio, suitable kinetic properties, no apparent PET signal in bone, and higher detected nonspecific PET signal compared to 11C radioligands, making it a promising candidate for imaging 5-HT1A receptors in humans.
Radio-TLC techniques were used to measure the rate of 18F-mefway metabolism in vivo. The results indicated initial rapid metabolism of 18F-mefway followed by a slow metabolism component such that 10–15% of the radioactivity in the plasma was attributed to parent 18F-mefway after 90 minutes in the blood. Low counting statistics in the blood samples at late times due to rapid metabolism and low fP limited the precision of these measurements. The rate of 18F-mefway metabolism was slightly slower than 11C-WAY-100635 and 18F-FCWAY (21, 22).
The in vivo metabolism of 11C-WAY-100635 and 18F-FCWAY result in radiolabeled cyclohexanecaryboxylic acid species, both of which crossed the blood brain barrier (21, 22). A similar potential metabolite species of 18F-mefway, 18F-trans-4-fluoromethylcyclohexanoic acid, showed little to no brain penetration in rat PET studies (23). We have not fully characterized the metabolite species of 18F-mefway in humans for the present work, thus the potential for 18F-trans-4-fluoromethylcyclohexanoic acid accumulation in human brain remains a matter for future studies. The fP of 18F-mefway was measured at 5.1%, with little variability between subjects. This low free fraction is consistent with the values of other radioligands specific to 5-HT1A receptors.
Specific uptake of 18F-mefway in human brain was consistent with the cerebral distribution of 5-HT1A receptors (24). The highest measured 18F-mefway BPND levels were 2.4 in the regions in the mesial temporal lobe, with values of 1.6 in insular cortex, 1.2 in anterior cingulate gyrus, 0.8 in raphe nuclei, and 0.6–0.9 in occipital cortex. These human 18F-mefway BPND values are roughly 3–4 times lower than reported 11C-WAY-100635 BPND values derived using an atlas based approach (25). However, a direct comparison of these radioligands in human subjects with the same scanners and data processing techniques will be needed to identify in vivo differences between radiotracers. Such studies previously performed in nonhuman primates demonstrated comparable levels of BPND between 18F-mefway and 11C-WAY-100635 (11). While interspecies differences may explain some of the variation in 18F-mefway binding between humans and monkeys, the atlas-based ROI definition in this work likely reduced BPND due to spatial averaging compared to the manual ROI definition in our previous work.
The behavior of 5-HT1A-specific radioligands in the cerebellum is a crucial issue for accurate assay of 5-HT1A binding. Use of the cerebellum with reference region analysis strategies can avoid the need for arterial blood sampling. The cerebellum has been used as a reference region for quantitation of BPND with 5-HT1A radioligands due to minimal specific binding levels (26). Small levels of specific 11C-WAY-100635 binding were subsequently observed in the cerebellar gray matter and vermis (27), indicating a potential underestimation in BPND with the use of cerebellar gray matter. White matter regions have been proposed as potential reference regions to avoid this bias of BPND estimates (28,29), which assumes similar nonspecific radioligand behavior in both white matter and gray matter. We speculate that the strategies developed to account for potential binding of other 5-HT1A radioligands in the cerebellum will be applicable to 18F-mefway procedures as well. Further investigation is needed to fully characterize potential specific binding in the cerebellum and its ramifications on the analysis of 18F-mefway PET data.
The time course of 18F-mefway in the cerebellum was characterized by rapid washout followed by low radioactivity concentrations (Figure 4). These cerebellar characteristics are similar for other 5-HT1A radioligands, resulting in low counting statistics in the cerebellum at late times. Such regions are subject to bias depending on the scatter correction and reconstruction algorithms used in processing the PET data (30), and subsequently bias BPND estimates when used as reference regions. Given the similar cerebellar SUV values of 18F-mefway and 11C-WAY-10036 (31) at 90 minutes, the 110 minute half-life of the 18F isotope compared to the 20 minute half-life of 11C yields over 12-fold more real measured counts by the PET scanner. This characteristic, and the opportunity to conduct PET studies with an off-site cyclotron, are important practical advantages of 18F-labelled 5-HT1A radioligands. One potential cause of low cerebellar uptake for 5-HT1A specific radioligands is the p-glycoprotein transporter, as demonstrated for 18F-MPPF (32,33). The potential regulation of 18F-mefway brain penetration by p-glycoprotein is an important question for future investigation.
Previous 18F-FCWAY studies exhibited bone uptake of 18F-fluoride ions, resulting in the spill-in of detected PET signal from the surrounding skull into the cerebellum and subsequently required the use of enzyme inhibitors for accurate 18F-FCWAY quantification (7, 8). Low levels of PET signal in bone were evident in rat 18F-mefway studies (34), but not in rhesus monkeys (11). The present data were closely inspected for potential bone uptake of radiolabeled species in human subjects. The PET images did not indicate any areas of elevated 18F-mefway uptake in regions immediately surrounding the brain. Cerebellar time activity curves decreased at late times, instead of plateauing or increasing (which would reflect the spill-in of PET signal from surrounding bone). Furthermore, the radio-TLC analysis did not reveal a detectable signal at the expected location of 18F-fluoride ion elution (the origin; Figure 3A). These studies provide evidence for negligible accumulation of radiolabeled species in bone, however, they are not conclusive. Future planned PET-CT studies, providing accurate localization of skull, will conclusively determine the reported absence of bone uptake. Typical 11C-WAY-100635 scans require 90 minutes for accurate quantification. While 120 minutes of 18F-mefway data were acquired for the present scans, the data were truncated at 90 minutes and BPND values were recalculated with MRTM. Calculated BPND from the 90 minutes truncated data set agreed well with BPND from the full data set, with R2=0.99. There was a slight negative bias due to a systematic BPND underestimation of 3% in the mesial temporal lobe regions of highest 18F-mefway binding. This small bias in regions of extreme 18F-mefway binding may be acceptable in exchange for reduced duration of scanning procedures. Therefore it is likely that 90 minutes will be an appropriate scanning time for accurate quantification of 18F-mefway binding.
Values of 18F-mefway TRV averaged 8% across all regions, indicating good agreement in repeated scans. The ICC values were very strong in regions of high 18F-mefway binding. Reduced ICC values were observed in regions of lower 18F-mefway specific binding, likely due to lower BPND values in these regions. The test-retest properties of 18F-mefway are encouraging for future human PET studies implementing a two-scan experimental design.
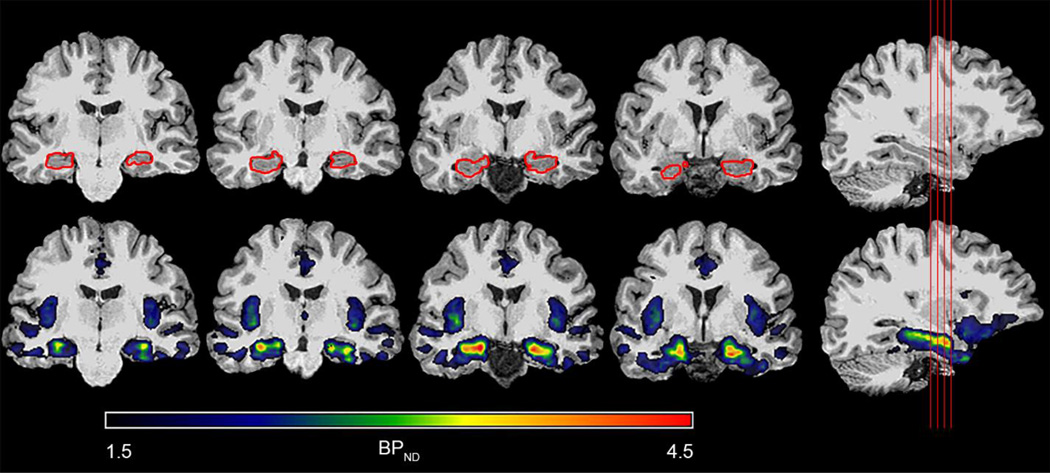
The binding profile of 18F-mefway allowed for close inspection of the regional distribution of specific binding in the mesial temporal lobe, as visualized in Figure 7. The region of highest 18F-mefway binding was the hippocampus. Relatively lower binding levels were observed in the subiculum sublayer, located more medially than CA1-CA4, and the amygdala. Less 18F-mefway binding was also evident in the parahippocampal gyrus and the most posterior regions of the hippocampus near the crux of the fornix. These differences in specific 18F-mefway uptake yielded exquisite delineation of 5-HT1A binding in the mesial temporal lobe. Consequently, 18F-mefway PET data from this region, most prominently in the hippocampus, may have clinical utility in studying both healthy pathology and neurological and psychiatric disorders that affect the mesial temporal lobe.
Figure 7.
Delineation of specific 18F-mefway binding in the mesial temporal lobe. The top row shows a T1-weighted MRI with the corresponding hippocampal FreeSurfer mask drawn in red, while the bottom row shows a 18F-mefway BPND parametric image overlaid on the same MRI. Note the BPND linear thresholding ranges from 1.5 to 4.5. The red lines on the far right sagittal slice indicate the location of the corresponding coronal slices.
Conclusion
These initial studies of 18F-mefway in humans prove highly promising. The simple radiochemical production, high specific radioligand uptake, 18F radiolabel, and lack of PET signal in bone make 18F-mefway a promising candidate for assay of 5-HT1A receptors with human PET. Future studies to assess the viability of 18F-mefway in pathology-specific populations are merited.
Acknowledgements
The authors would like to thank Prof. R. Jerry Nickles and Hector Valdovinos for assistance with radioisotope production, Dr. Dhanabalan Murali for assistance with radiochemical production of 18F-mefway, and Dr. Steve Kecskemeti for assistance with MRI data acquisition and processing. Sharon Kuruvilla provided important assistance with figure preparation. We are grateful to Barb Mueller and Travis Doran for their contributions with scanning procedures, and to the volunteer subjects for their participation in this study. Support for this research was provided by R33AG030524, T32CA009206, P30HD03352.
Footnotes
Disclosure
The authors have no potential conflicts of interest to report.
References
- 1.Blier P, Ward NM. Is there a role for 5-HT1A agonists in the treatment of depression? Biol Psychiatry. 2003;53:193–203. doi: 10.1016/s0006-3223(02)01643-8. [DOI] [PubMed] [Google Scholar]
- 2.Raymond JR, Mukhin YV, Gettys TW, Garnovskaya MN. The recombinant 5-HT1A receptor: G protein coupling and signaling pathways. Br J Pharmacol. 1999;127:1751–1764. doi: 10.1038/sj.bjp.0702723. [DOI] [PMC free article] [PubMed] [Google Scholar]
- 3.Pike VW, McCarron JA, Lammertsma AA, et al. Exquisite delineation of 5-HT1A receptors in human brain with PET and 11C-WAY-100635. Eur. J. Pharmacol. 1996:R5–R7. doi: 10.1016/0014-2999(96)00079-9. [DOI] [PubMed] [Google Scholar]
- 4.Kumar JSD, Mann JJ. PET tracers for 5-HT1A receptors and uses thereof. Drug Discov Today. 2007;12:748–756. doi: 10.1016/j.drudis.2007.07.008. [DOI] [PubMed] [Google Scholar]
- 5.Aznavour N, Zimmer L. 18F-MPPF as a tool for the in vivo imaging of 5-HT1A receptors in animal and human brain. Neuropharmacology. 2007;52:695–707. doi: 10.1016/j.neuropharm.2006.09.023. [DOI] [PubMed] [Google Scholar]
- 6.Carson RE, Lang L, Watabe H, et al. PET evaluation of 18F-FCWAY, an analog of the 5-HT1A receptor antagonist, WAY-100635. Nucl Med Biol. 2000;27:493–497. doi: 10.1016/s0969-8051(00)00118-9. [DOI] [PubMed] [Google Scholar]
- 7.Carson RE, Wu Y, Lang L, et al. Brain uptake of the acid metabolites of 18F-labeled WAY 100635 analogs. J Cereb Blood Flow Metab. 2003;23:249–260. doi: 10.1097/01.WCB.0000046145.31247.7A. [DOI] [PubMed] [Google Scholar]
- 8.Tipre DN, Zoghbi SS, Liow JS, et al. PET imaging of brain 5-HT1A receptors in rat in vivo with 18F-FCWAY and improvement by successful inhibition of radioligand defluorination with miconazole. J. Nucl. Med. 2006;47:345–353. [PubMed] [Google Scholar]
- 9.Wooten DW, Hillmer AT, Murali D, et al. An in vivo comparison of cis- and trans-18F-mefway in the nonhuman primate. Nucl. Med. Biol. 2011;38:925–932. doi: 10.1016/j.nucmedbio.2011.04.001. [DOI] [PMC free article] [PubMed] [Google Scholar]
- 10.Saigal N, Pichika R, Easwaramoorthy B, et al. Synthesis and biologic evaluation of a novel serotonin 5-HT1A receptor radioligand, 18F-labeled mefway, in rodents and imaging by PET in a nonhuman primate. J Nucl Med. 2006;47:1697–1706. [PubMed] [Google Scholar]
- 11.Wooten DW, Moraino JD, Hillmer AT, et al. In vivo kinetics of 18F-Mefway: a comparison with 11C-WAY100635 and 18F-MPPF in the nonhuman primate. Synapse. 2011;65:592–600. doi: 10.1002/syn.20878. [DOI] [PMC free article] [PubMed] [Google Scholar]
- 12.Wooten DW, Hillmer AT, Moirano JM, et al. 5-HT1A Sex based differences in Bmax, in vivo KD and BPND in the nonhuman primate. NeuroImage. 2013;77:125–132. doi: 10.1016/j.neuroimage.2013.03.027. [DOI] [PMC free article] [PubMed] [Google Scholar]
- 13.Christian BT, Wooten DW, Hillmer AT, et al. Serotonin transporter genotype affects serotonin 5-HT1A binding in primates. J Neurosci. 2013;33:2512–2516. doi: 10.1523/JNEUROSCI.4182-12.2013. [DOI] [PMC free article] [PubMed] [Google Scholar]
- 14.Hillmer AT, Wooten DW, Tudorascu D, et al. The effects of chronic alcohol self-administration on serotonin 5-HT1A binding in nohuman primates. Drug Alcohol Depend. 2014 doi: 10.1016/j.drugalcdep.2014.08.015. In Press. [DOI] [PMC free article] [PubMed] [Google Scholar]
- 15.Jenkinson M, Bannister P, Brady M, Smith S. Improved optimization for the robust and accurate linear registration and motion correction of brain images. Neuroimage. 2002;17:825–841. doi: 10.1016/s1053-8119(02)91132-8. [DOI] [PubMed] [Google Scholar]
- 16.Innis RB, Cunningham VJ, Delforge J, et al. Consensus nomenclature for in vivo imaging of reversibly binding radioligands. J Cereb Blood Flow Metab. 2007;27:1533–1539. doi: 10.1038/sj.jcbfm.9600493. [DOI] [PubMed] [Google Scholar]
- 17.Ichise M, Liow J-S, Lu J-Q, et al. Linearized reference tissue parametric imaging methods: application to 11C-DASB positron emission tomography studies of the serotonin transporter in human brain. J Cereb Blood Flow Metab. 2003;23:1096–1112. doi: 10.1097/01.WCB.0000085441.37552.CA. [DOI] [PubMed] [Google Scholar]
- 18.Logan J, Fowler JS, Volkow ND, Wang GJ, Ding YS, Alexoff DL. Distribution volume ratios without blood sampling from graphical analysis of PET data. J Cereb Blood Flow Metab. 1996;16:834–840. doi: 10.1097/00004647-199609000-00008. [DOI] [PubMed] [Google Scholar]
- 19.Shrout PE, Fleiss JL. Intraclass correlations: uses in assessing rater reliability. Psychol Bull. 1979;86:420–428. doi: 10.1037//0033-2909.86.2.420. [DOI] [PubMed] [Google Scholar]
- 20.Shrout PE. Statistical methods in medical research. 1998 doi: 10.1177/096228029800700306. [DOI] [PubMed] [Google Scholar]
- 21.Osman S, Lundkvist C, Pike VW, et al. Characterisation of the appearance of radioactive metabolites in monkey and human plasma from the 5-HT1A receptor radioligand, carbonyl-11C-WAY-100635--explanation of high signal contrast in PET and an aid to biomathematical modelling. Nucl Med Biol. 1998;25:215–223. doi: 10.1016/s0969-8051(97)00206-0. [DOI] [PubMed] [Google Scholar]
- 22.Ma Y, Kiesewetter DO, Lang L, et al. Determination of 18F-FCWAY, 18F-FP-TZTP, and their metabolites in plasma using rapid and efficient liquid-liquid and solid phase extractions. Nucl Med Biol. 2003;30:233–240. doi: 10.1016/s0969-8051(02)00452-3. [DOI] [PubMed] [Google Scholar]
- 23.Saigal N, Bajwa AK, Faheem SS, et al. Evaluation of serotonin 5-HT1A receptors in rodent models using 18F-mefway PET. Synapse. 2013;67:596–608. doi: 10.1002/syn.21665. [DOI] [PMC free article] [PubMed] [Google Scholar]
- 24.Hall H, Lundkvist C, Halldin C, Farde L, Pike VW, McCaroon JA, Fletcher A, Cliffe IA, Barf T, Wikstrom H, Sedvall G. Autoradiographic localization of 5-HT1A receptors in the post-mortem human brain using 3H-WAY-100635 and 11C-WAY-100635. Brain Res. 1997;745:96–108. doi: 10.1016/s0006-8993(96)01131-6. [DOI] [PubMed] [Google Scholar]
- 25.Rabiner EA, Messa C, Sargent PA, et al. A database of 11C-WAY-100635 binding to 5-HT1A receptors in normal male volunteers: Normative data and relationship to methodological, demographic, physiological, and behavioral variables. Neuroimage. 2002;15:620–632. doi: 10.1006/nimg.2001.0984. [DOI] [PubMed] [Google Scholar]
- 26.Gunn RN, Sargent PA, Bench CJ, et al. Tracer kinetic modeling of the 5-HT1A receptor ligand carbonyl-11C-WAY-100635 for PET. Neuroimage. 1998;8:426–440. doi: 10.1006/nimg.1998.0379. [DOI] [PubMed] [Google Scholar]
- 27.Parsey RV, Arango V, Olvet DM, Oquendo MA, Van Heertum RL, Mann JJ. Regional heterogeneity of 5-HT1A receptors in human cerebellum as assessed by positron emission tomography. J Cereb Blood Flow Metab. 2005;25:785–793. doi: 10.1038/sj.jcbfm.9600072. [DOI] [PubMed] [Google Scholar]
- 28.Hirvonen J, Kajander J, Allonen T, Oikonen V, Någren K, Hietala J. Measurement of serotonin 5-HT1A receptor binding using positron emission tomography and carbonyl-11C-WAY-100635-considerations on the validity of cerebellum as a reference region. J Cereb Blood Flow Metab. 2007;27:185–195. doi: 10.1038/sj.jcbfm.9600326. [DOI] [PubMed] [Google Scholar]
- 29.Giovacchini G, Conant S, Herscovitch P, Theodore WH. Using cerebral white matter for estimation of nondisplaceable binding of 5-HT1A receptors in temporal lobe epilepsy. J Nucl Med. 2009;50:1794–1800. doi: 10.2967/jnumed.109.063743. [DOI] [PMC free article] [PubMed] [Google Scholar]
- 30.Belanger MJ, Mann JJ, Parsey RV. OS-EM and FBP reconstructions at low count rates: Effect on 3D PET studies of 11C-WAY-100635. Neuroimage. 2004;21:244–250. doi: 10.1016/j.neuroimage.2003.08.035. [DOI] [PubMed] [Google Scholar]
- 31.Parsey RV, Slifstein M, Hwan D-R, et al. Validation and reproducibility of measurement of 5-HT1A receptor parameters with [carbonyl-11C]WAY-100635 in humans: comparison of arterial and reference tissue input functions. J Cereb Blood Flow Metab. 2000;20:1111–1133. doi: 10.1097/00004647-200007000-00011. [DOI] [PubMed] [Google Scholar]
- 32.Passchier J, van Waarde A, Doze P, Elsinga PH, Vaalburg W. Influence of P-glycoprotein on brain uptake of 18F-MPPF in rats. Eur J Pharmacol. 2000;407:273–280. doi: 10.1016/s0014-2999(00)00752-4. [DOI] [PubMed] [Google Scholar]
- 33.Tournier N, Cisternino S, Peyronneau MA, et al. Discrepancies in the P-glycoprotein-mediated transport of 18F-MPPF: a pharmacokinetic study in mice and non-human primtes. Pharm. Res. 2012;29:2468–2476. doi: 10.1007/s11095-012-0776-7. [DOI] [PubMed] [Google Scholar]
- 34.Choi JY, Kim CH, Jeon TJ, et al. Effective MicroPET imaging of brain 5-HT1A receptors in rats with 18F-mefway by suppression of radioligand defluorination. Synapse. 2012;66:1015–1023. doi: 10.1002/syn.21607. [DOI] [PubMed] [Google Scholar]


