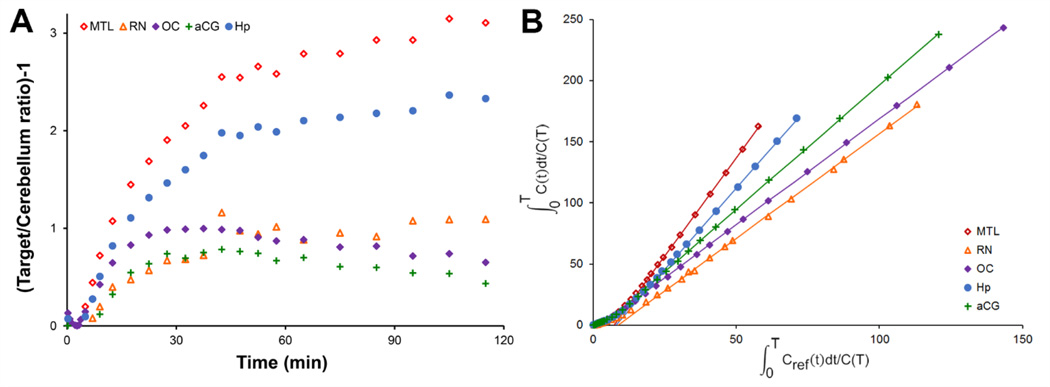
Figure 5.
Kinetic properties of 18F-mefway in vivo. A shows 18F-mefway target/cerebellum ratios. B illustrates Logan plots, with t*=45 minutes, to visualize pseudoequilibrium of the tracer in various regions of the brain. Regions shown include focal areas of uptake in the mesial temporal lobe (MTL,  ); hippocampus (Hp,
  ); anterior cingulate gyrus (aCG,
  ); raphe nuclei (RN,
  ); and occipital cortex (OC,
  ).
).

