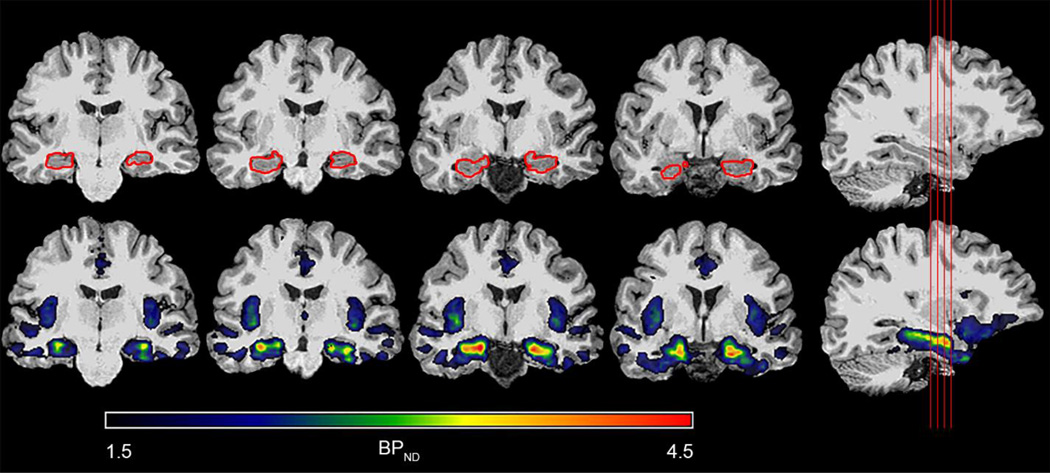
Figure 7.
Delineation of specific 18F-mefway binding in the mesial temporal lobe. The top row shows a T1-weighted MRI with the corresponding hippocampal FreeSurfer mask drawn in red, while the bottom row shows a 18F-mefway BPND parametric image overlaid on the same MRI. Note the BPND linear thresholding ranges from 1.5 to 4.5. The red lines on the far right sagittal slice indicate the location of the corresponding coronal slices.

