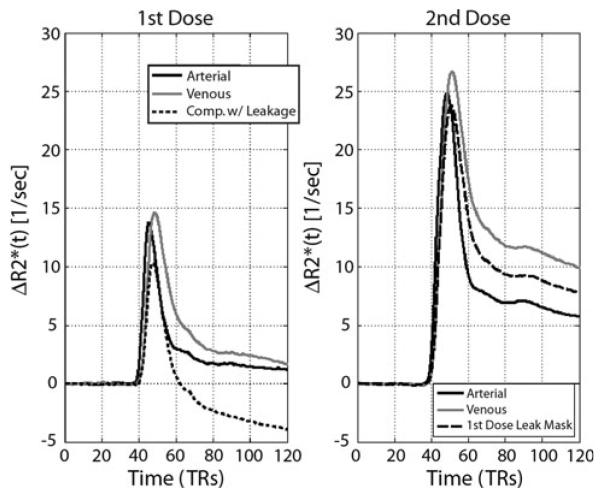
Fig. 1.
ΔR2* time-series for each of the components averaged across patients for each dose. For the first dose (left), time-series are shown for the arterial, venous, and the leakage-affected third component. The time-series for the second dose shown include arterial, venous, and the average signal within a mask defined by the leakage-affected first dose component

