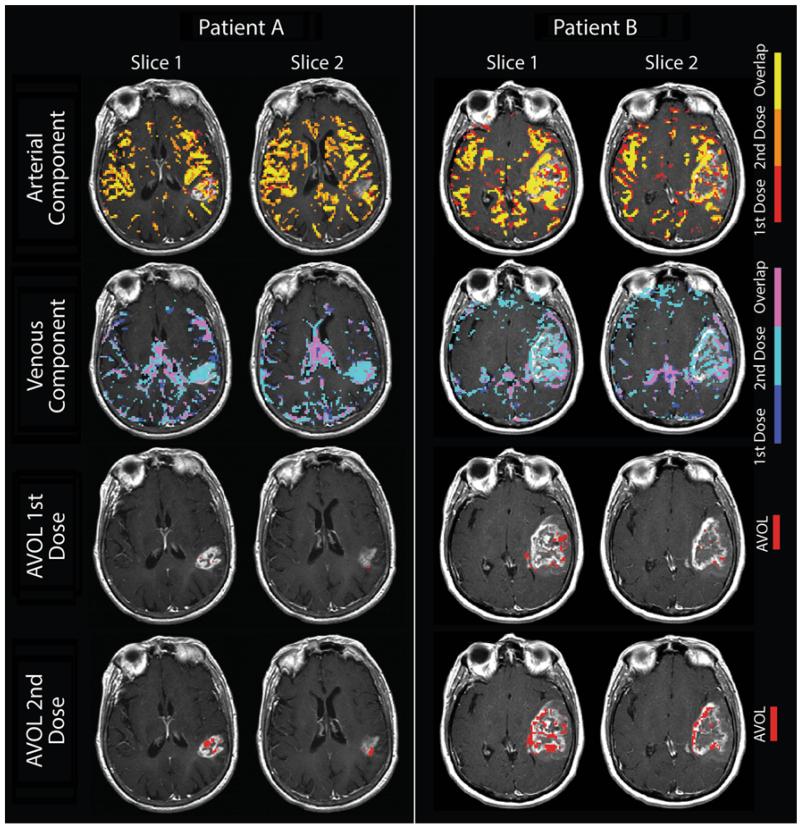
Fig. 2.
Demonstration of component separation of DSC MRI by independent component analysis and the resulting overlap between the two contrast doses. Component maps are overlaid on T1+ contrast imaging from two representative patients. The first and second rows show the overlap of the arterial and venous components for each dose. Note the dominance of the second dose’s venous component within the enhancing tumor (teal). The bottom two rows show the AVOL within enhancement resulting from the first and second dose DSC acquisitions. Note the percentage of enhancement classified as AVOL is markedly increased for the second dose

