
Figure 4.
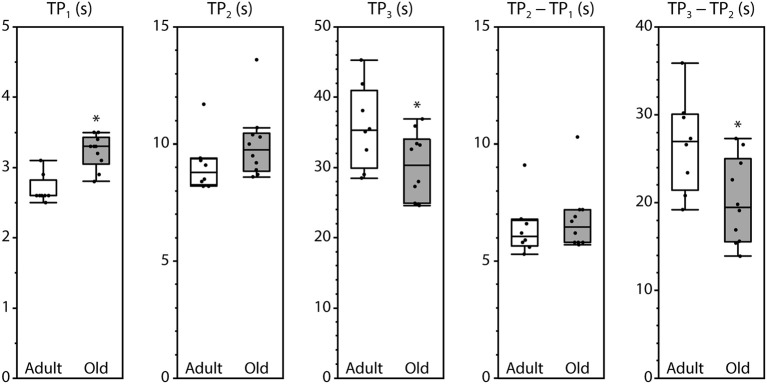
Timing of the fluorescence oscillation peaks in LMB muscles from adult and old mice. Definitions for the time parameters are shown in Figure 1C. Box plots indicate the median and the 25th and 75th quartiles. The vertical lines that originate from the top and bottom surfaces of the boxes extend to the outermost data points that fall within 1.5× the difference between the 75th and 25th quartiles. Asterisks indicate significant differences (p < 0.05). Data were collected from n = 8 and n = 10 LMB muscles from adult and old mice, respectively.