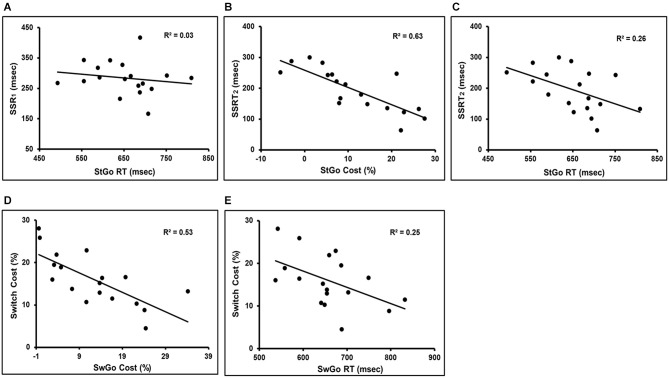
Figure 2.
It shows the linear regression results of the “go” response cost/RT in the presence of the inhibition trials and their relation to the Switch cost and SSRT. There was no significant correlation between SSRT1 and StGo RT (Panel A). Panels (B,C) are the regression results between the SSRT2 and the StGo cost or StGo RT. Panels (D,E) show the regression results between the Switch cost and the SwGo cost or SwGo RT. SwGo = the “go” trials in the Switch condition; StGo = the “go” trials in the Stop condition; SSRT1 = stop-signal response time; SSRT2 = adjusted stop-signal response time.

