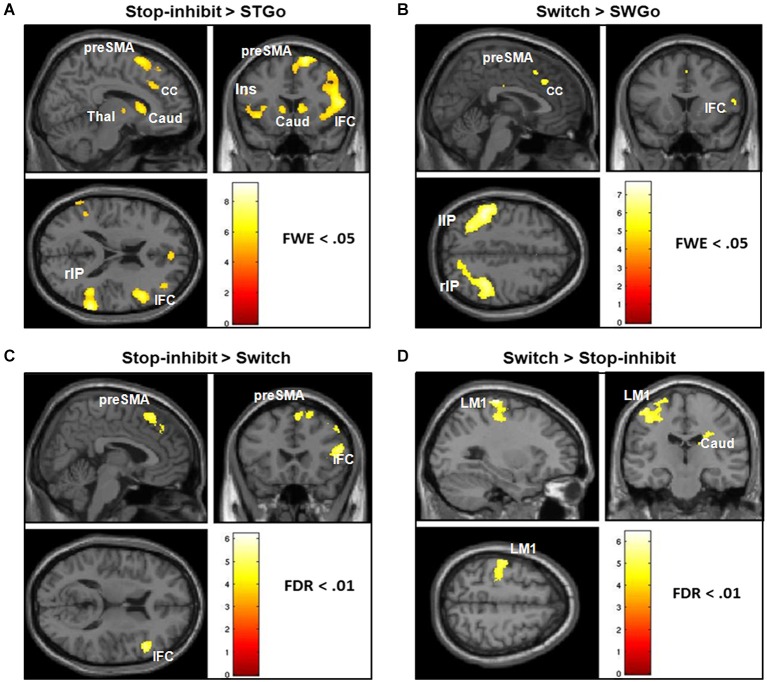
Figure 3.
It shows the results of whole-brain analysis of fMRI BOLD activation of responses associated with the Switch and successfully stopped (Stop-inhibit) responses. Panels (A,B) show the differential activation of the Stop-inhibit and Switch responses after subtracting out activation associated with the “go” responses. Panels (C,D) show brain regions that had significantly stronger activation during the Stop-inhibit responses relative to Switch, and during the Switch relative to the Stop-inhibit responses. StGo = “go” responses in the Stop condition; SwGo = “go” responses in the Switch condition; FDR = error correction using the topological false-discovery rate.

