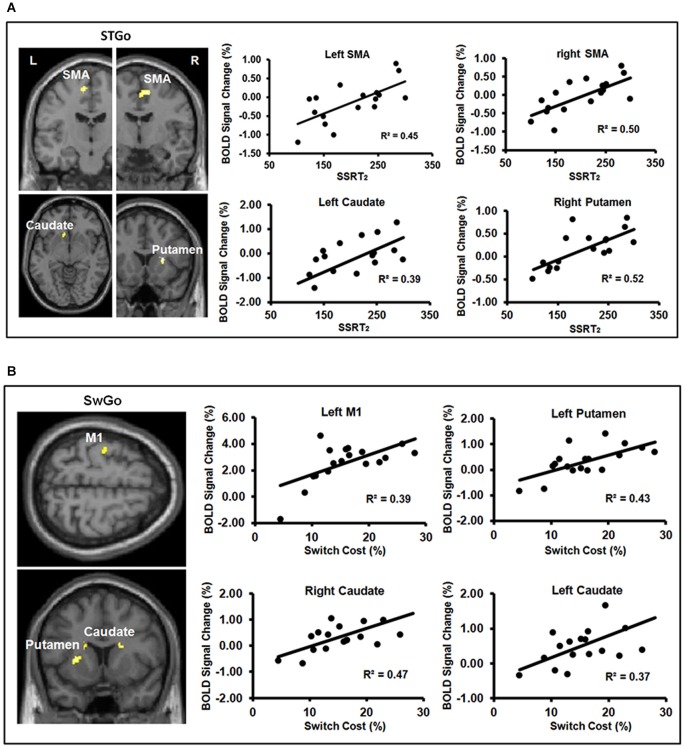
Figure 4.
(A,B) show the results of linear regressions between behavioral measures of inhibition efficiency and percent BOLD signal change during the “go” responses. Panel (A) shows significant linear relations between the behavioral measure ( SSRT2) of Stop efficiency and BOLD signal change in the FBG regions associated with the “go” responses in the Stop condition. Panel (B) shows significant linear relations between the Switch cost/efficiency and BOLD signal change in the FBG regions associated with the “go” responses in the Switch condition. M1 = primary motor cortex; SMA = supplementary motor area. (Note: One subject’s data was not included in Panel (A) because of an unusually short SSRT2 (64 ms) to avoid inflating the regression coefficient).

