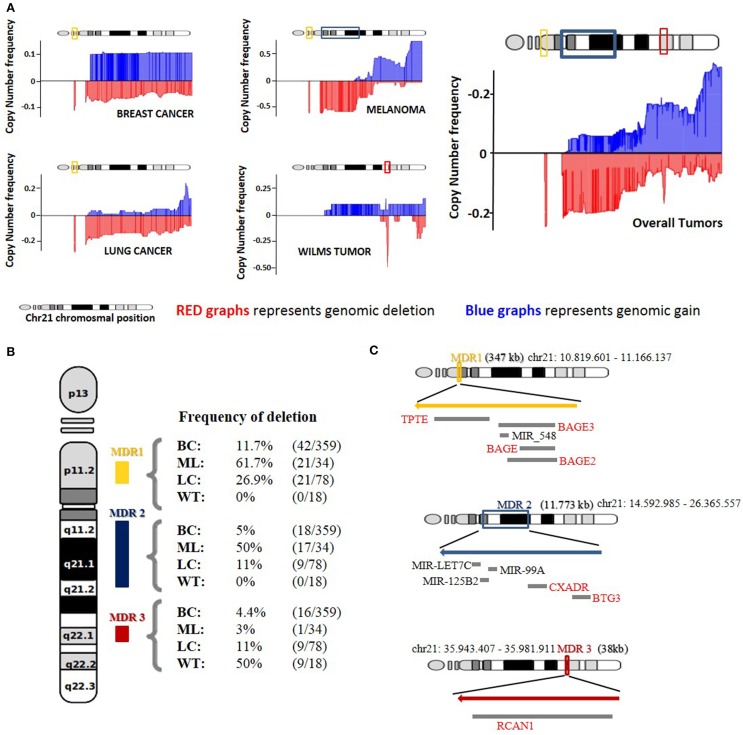
Figure 1.
Copy number analysis of Chromosome 21. (A) Representation of genomic gain (blue) and deletion (red) frequencies on four different tumor types and median average of all tumors together. (B) Deletion frequency for the three major deleted regions (MDR) in breast cancer (BC), melanoma (ML), lung tumors (LT), and Wilms Tumor (WT) on HSA21. (C) Representation of the three MDR based on genomic localization and size with those genes and miRNAs that showed downregulation in the gene expression correlation analysis.

