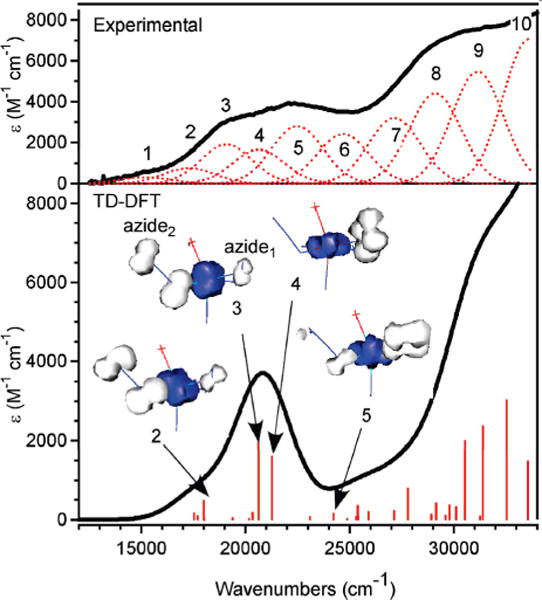
Figure 10.

Experimental (top) and TD-DFT calculated (bottom) Abs spectra of LFe(N3)2. Electron density difference maps (EDDMs) for the dominant LMCT transitions corresponding to Gaussian bands 2–5 in the experimental spectrum are shown above the computed spectrum, where white and blue indicate electron density loss and gain, respectively.
