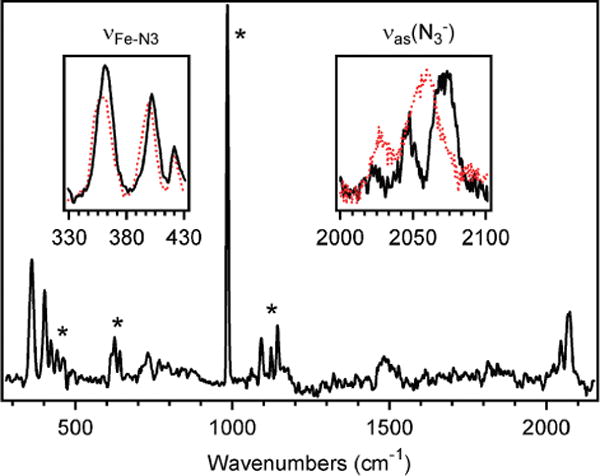
Figure 7.

RR spectrum at 77 K of a solid-state sample of LFe(N3)2 obtained with 17 606 cm−1 (568 nm) laser excitation. Peaks associated with Na2SO4, which was added as an internal standard, are designated by an asterisk (*). The insets are expanded views of the νFe–N3 and νas(N3−) features of LFe(N3)2 and LFe(15NN2)2 (solid black and dotted red lines, respectively). All data were taken using 20 mW laser power at the sample.
