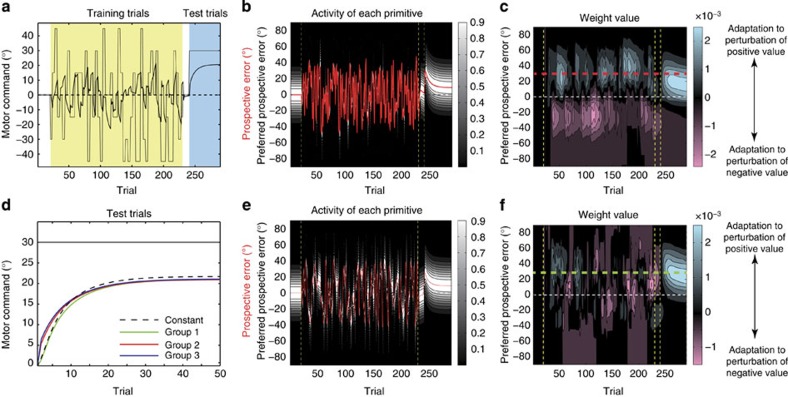
Figure 2. Structural learning.
We investigated whether our model could explain the entire structural learning process. Each pt was randomly sampled from the subset s=(−45°, −30°, −15°, 0°, 15°, 30°, 45°) in the training trials. In groups 1, 2 and 3, the perturbation sequence varied in every trial, every two trials and every three trials, respectively. Washout trials were inserted between the training and test trials. These washout trials excluded the possibility that the movement error in the last training trial affects the learning speed in the test trials. During the test phase, a constant visuomotor rotation, p=(30°, ⋯, 30°), was imposed. (a) Trial-by-trial change of xt (thick line) and pt (thin line) in group 2. (b) Activity of each primitive in group 2, where a strong white colour indicates high activity. The vertical axis shows the sorted preferred prospective error, μi, from −90° to 90°. The red line denotes the prospective error. (c) Weighting parameters of each primitive in group 2. Blue and red colours indicate weighting parameters to compensate for perturbations of positive and negative values, respectively. The red dotted line shows that motor primitives for a 30° PE learn the 30° perturbation in the training trials. (d) Comparison of xt in the adaptation to the visuomotor rotation among the three groups. Each xt value is calculated by averaging across 100 simulations. (e) Activities of each primitive in group 1. (f) Weighting parameters of each primitive in group 1. The green dotted line shows that motor primitives for a 30° PE do not learn the 30° perturbation in the training trials.

