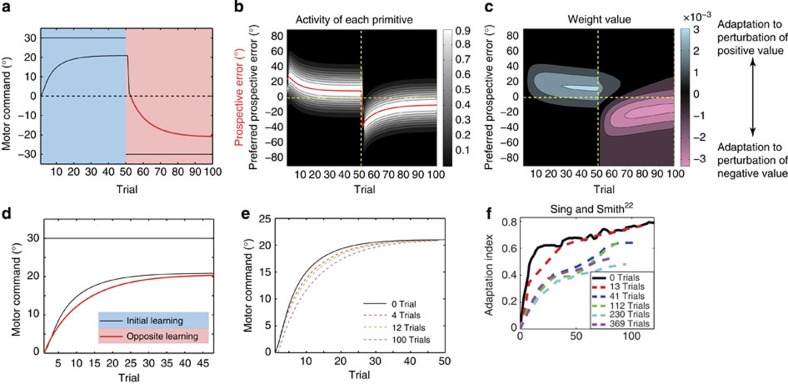
Figure 8. Anterograde interference.
To determine whether our model could explain this effect, we simulated an experiment in which a 30° visual rotation for 50 trials (the initial learning phase) was followed by a −30° visuomotor rotation for 50 trials (the opposite learning phase). (a) Trial-by-trial change of pt and xt averaged across 10 simulations. (b) Activities of each primitive, with a strong white colour indicating high activity. The red line denotes the prospective error, êt. Vertical dotted line is drawn at the trial at which the initial learning phase switches to the opposite learning phase. The horizontal dotted line denotes the line on which êt=0. (c) Weighting parameters of each primitive. Blue and red colours indicate weighting parameters to compensate for perturbations of positive and negative values, respectively. (d) Comparison of xt between the initial learning and opposite learning phases. In the opposite learning phase, the negative part of xt is drawn (red line in a). (e) Trial-by-trial change of xt in the opposite learning phase. Each dotted line denotes the dependence of xt on the length of the initial learning phase. (f) Previously reported savings by Sing and Smiath22 (reproduced from a previous study22).

