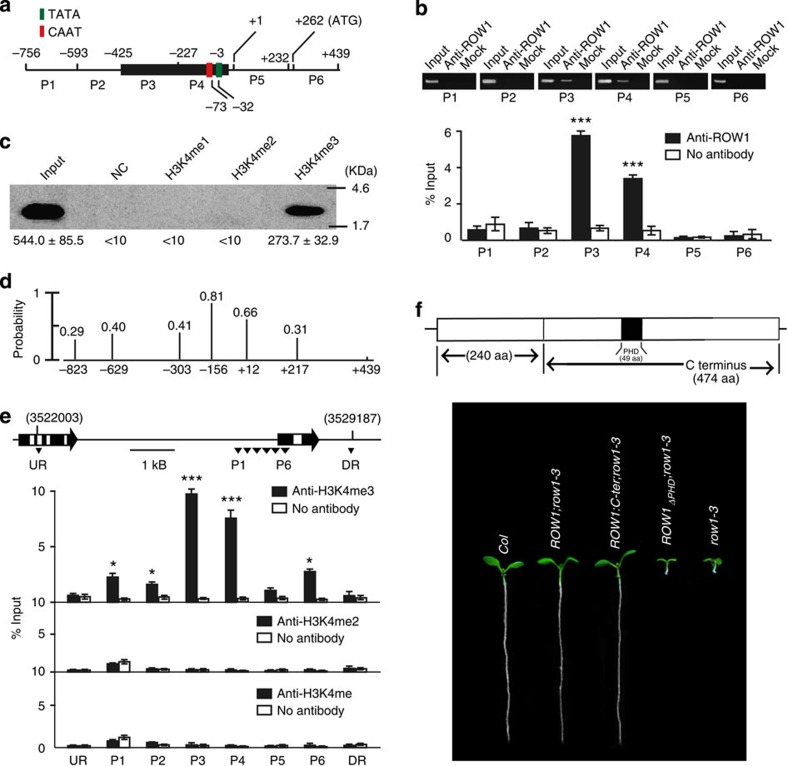
Figure 3. ROW1 specifically binds to H3K4me3 in the WOX5 promoter region.
(a) Schematic diagram showing the WOX5 promoter region used in the ChIP assay. (b) ChIP analysis of different WOX5 promoter regions using antibodies against ROW1. Upper panel, RT–PCR analysis. Input, 50 ng genomic DNA obtained from each respective promoter region; anti-ROW1, 10 μg of ROW1-specific antibodies were included in the reaction to precipitate the DNA; mock, negative control with no antibody added. Lower panel, qPCR analysis. Signal intensities were normalized relative to the input and were calculated from three independent experiments. (c) Purified PHD from ROW1 interacted only with biotinylated H3 peptides that were trimethylated at K4. Bound peptides were detected by western blot using biotin antibodies. (d) Theoretical analysis of nucleosome positioning along the WOX5 promoter region using a previously reported computational model32. The x axis denotes WOX5 chromosomal sequence from nucleotide −823 to +439 with the transcription initiation site set to +1. The y axis denotes the probability of predicted nucleosomes using the scale of 0.0–1.0. The exact positions of individual base pairs that has a >0.2 probability to initiate a nucleosome are shown as vertical black lines. (e) ChIP analysis of the same WOX5 promoter regions using antibodies against H3K4me3, H3K4me2 or H3K4me. Upper panel, genomic location of WOX5 is shown together with its direction of transcription. DR, downstream region; UR, upstream region. Lower panel, qPCR analysis. Signal intensities were normalized relative to the input and were calculated from three independent reactions. (f) ROW 1 or its C-terminal peptide (C-ter, 474 amino acids) rescued the row1-3 phenotype, but a ROW1 construct with a 49-amino-acid deletion of the PHD failed to do so. Shown are 7-day-old seedlings of various genotypes carrying different constructs. Error bars represent s.e. from three biological replicates. *, *** denotes P<0.05 or P<0.001, compared with the negative control with no antibody added, respectively. Uncropped images of panels b and c are shown in Supplementary Fig. 14.

