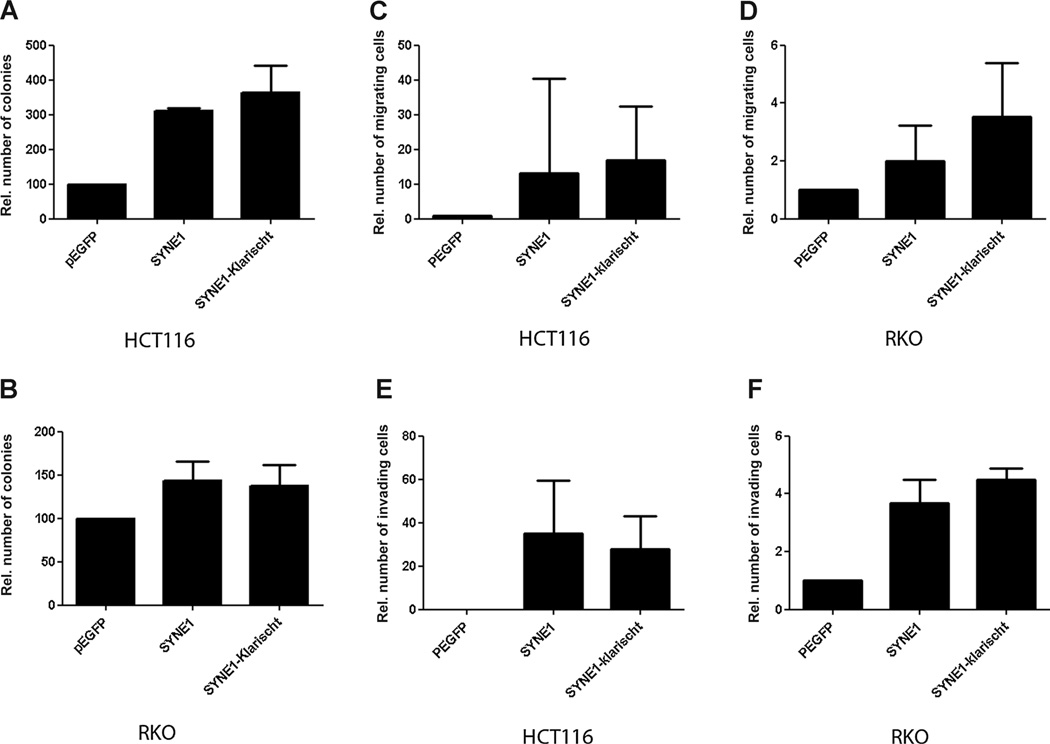
Figure 2.
Functional assays SYNE1. A and B, colony formation assay of cells transfected with SYNE1 expression vector or empty vector grown for 2weeks in medium containing antibiotics. Mean colony numbers relative to control transfectants are plotted (n = 3). Error bars, 95% CI. C and D, invasion assay through Matrigel-coated Transwells. Results represent mean number of SYNE1-transfected cells that passed through the Matrigel-coated membranes of the Transwell relative to control cells transfected with empty vector (n = 3). E and F, migration assay. Plotted are the mean numbers of SYNE1-transfected cells that migrated through Transwell membranes not coated with Matrigel relative to control cells transfected with empty vector (n = 3). Error bars, 95% CI.

