Figure 3.
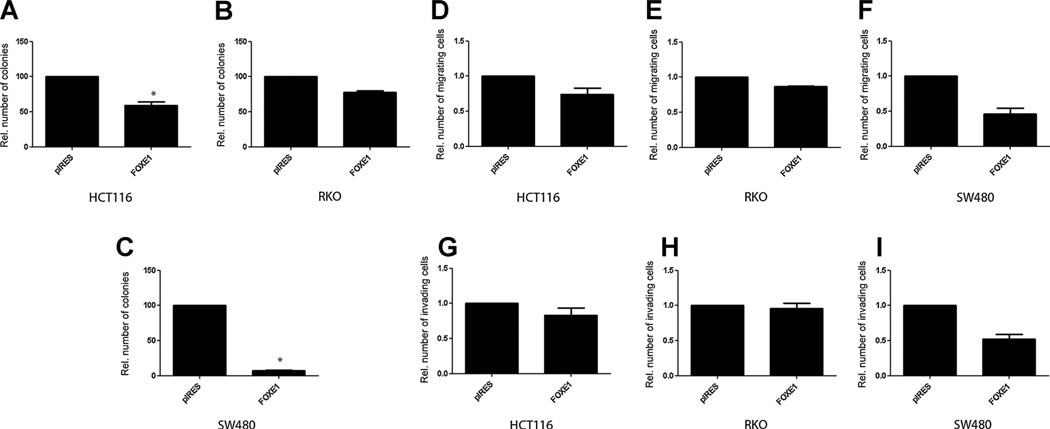
Functional assays FOXE1. A to C, colony formation assay of cells transfected with FOXE1 expression vector or empty vector grown for 2 weeks in medium containing antibiotics. Mean colony numbers relative to control transfectants are plotted (n = 3). Error bars, 95% CI. D to F, invasion assay through Matrigel-coated Transwells. Results represent mean number of FOX1-transfected cells that passed through the Matrigel-coated membranes of the Transwell relative to control cells transfected with empty vector (n = 3). G to I, migration assay. Plotted are the mean numbers of FOX1-transfected cells that migrated through Transwell membranes not coated with Matrigel relative to control cells transfected with empty vector (n = 3). Error bars, 95% CI. Melotte et al.

