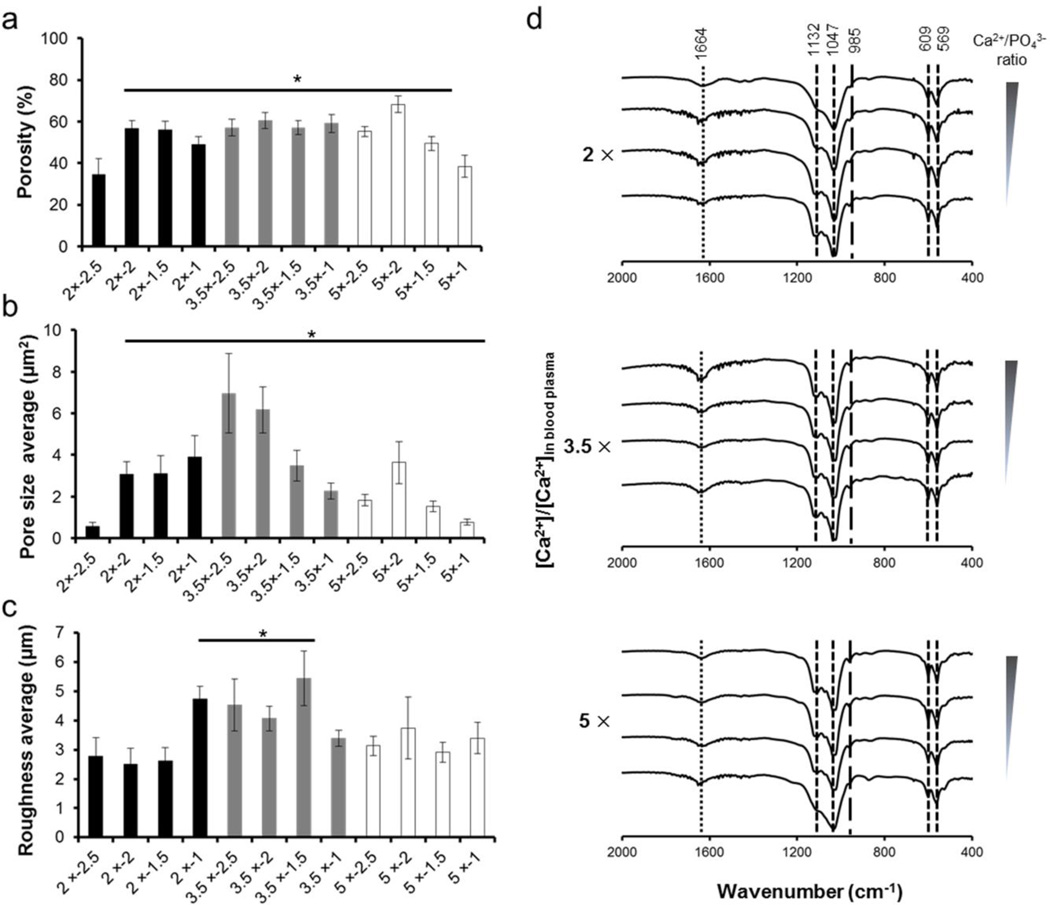
Fig. 2.
Characterization of mineral coatings. (a) Porosity, (b) Pore size area, (c) Roughness, and (d) FTIR spectra of mineral coatings. Porosity and pore size area were measured from imageJ software using SEM images of mineral coatings. Roughness was measured using an optical surface profiler. * indicate significant difference when compared with 2 × − 2.5 condition. Each peak from (d) indicates PO43− (- -), HPO42− (—) and CO32− (⋯) groups.

