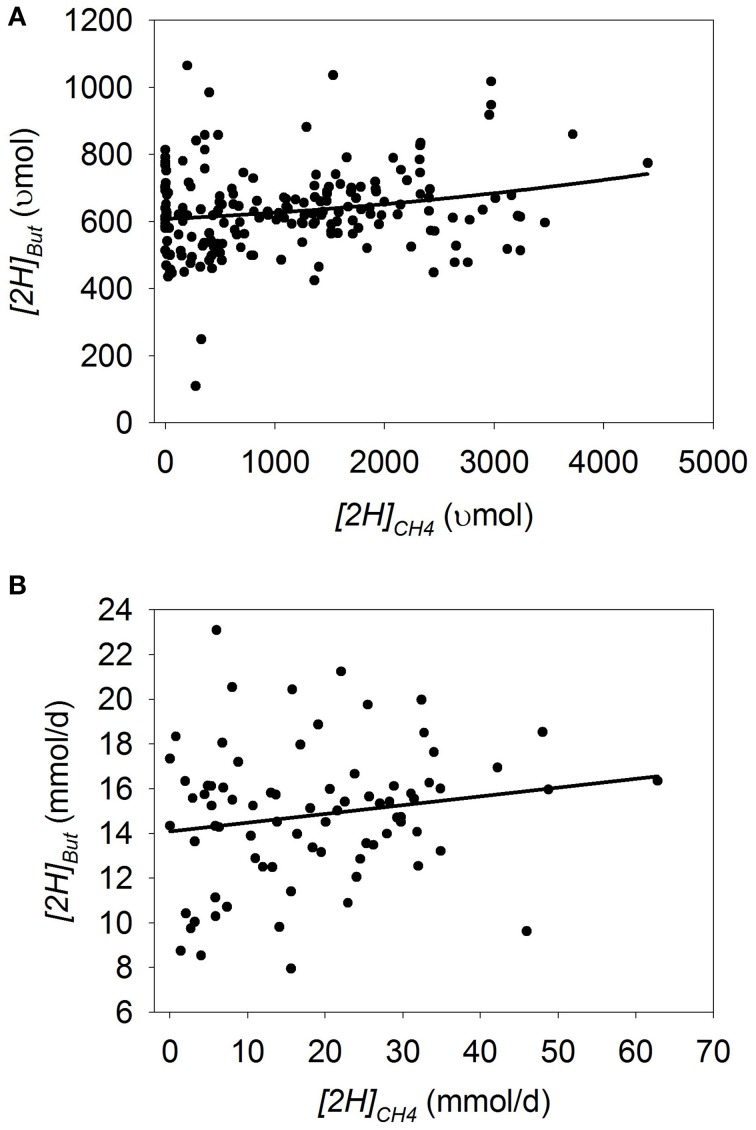
Figure 3.
Response of metabolic hydrogen incorporated into butyrate ([2H]But) to metabolic hydrogen incorporated into CH4 ([2H]CH4). Individual responses are adjusted by their experiment effect (exp): (A) Batch cultures: y = 556 (±42.4; p < 0.001) + exp (p < 0.001) + 0.0508 (± 0.061; p = 0.41) x + 1.94 × 10⁻⁵ (±1.29 × 10⁻⁵; p = 0.13) (x − 1366)2 + exp × x (p < 0.001); R2 = 0.93 (p < 0.001); (B) Continuous cultures: y = 14.4 (±1.05; p < 0.001) + exp (p < 0.001) + 0.012 (±0.056; p = 0.84) x + exp × x (p = 0.006); R2 = 0.87 (p < 0.001).

