
Figure 1.
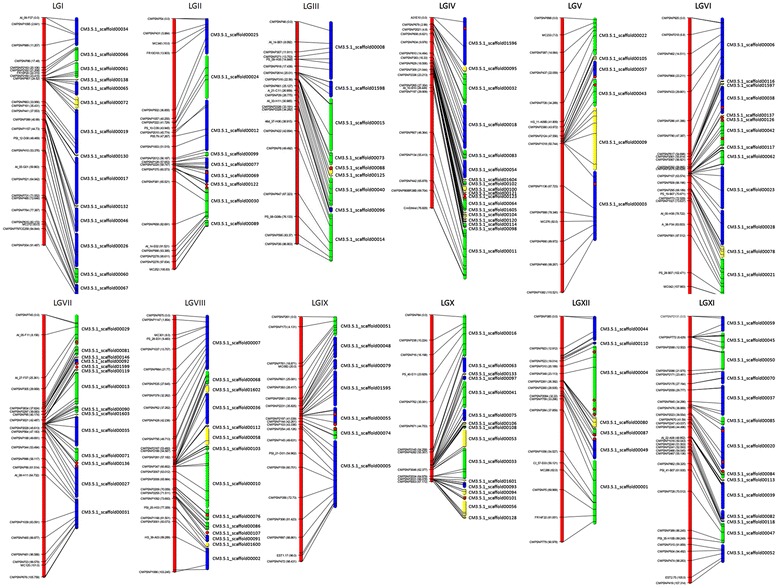
Anchoring of the melon scaffold genome assembly to the PS x SC F2 genetic map. Red bars represent the 12 melon linkage groups; SNPs are located according to genetic distance (cM). Melon genome scaffolds were positioned in each linkage group with corresponding genetic markers. Blue, scaffolds in positive orientation; green, scaffolds with negative orientation (reverse and complemented); yellow, scaffolds that were anchored but not oriented. Red dots represent locations of centromere-specific repeats inferred by in silico analysis.* Not all SNP names are represented in the genetic map.