Figure 1.

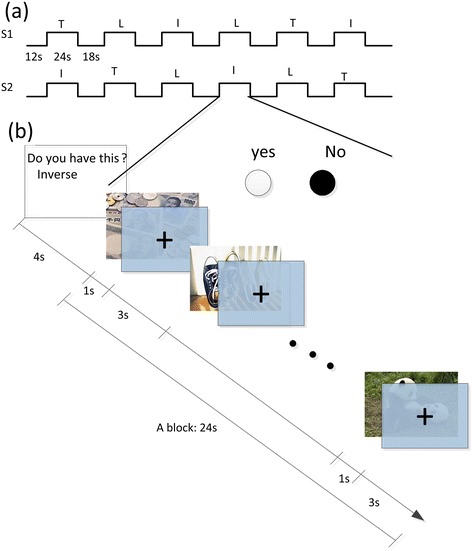
The schematic diagram of the experiment: (a) Pseudorandom order of two sequences. T = true, I = inverse, L = lie. (b) Schematic representation of a block.

The schematic diagram of the experiment: (a) Pseudorandom order of two sequences. T = true, I = inverse, L = lie. (b) Schematic representation of a block.