
Figure 4.
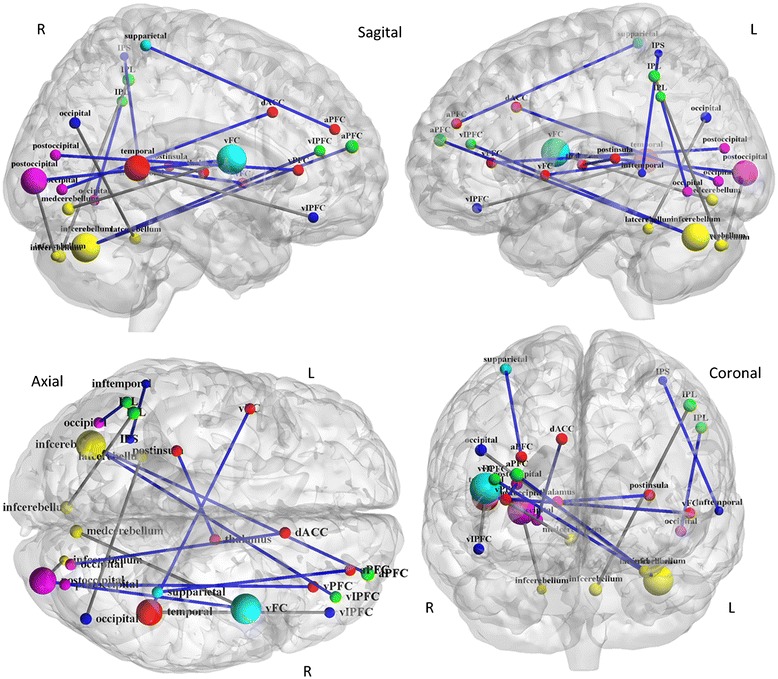
Deception-modulated functional connectivity. Regions are color-coded by category. Red represents the cingulo-opercular network; green represents the fronto-parietal network; dark blue represents the default network; light blue represents the sensorimotor network; purple presents the occipital network; and yellow represents the cerebellum. Functional connectivities are also color-coded, with blue lines representing stronger connections and gray lines representing weaker connections.